33
/fr/
AIzaSyAYiBZKx7MnpbEhh9jyipgxe19OcubqV5w
August 1, 2025
165313
Jordan
JOR
true
2
1
Persistence to grade 5, female (% of cohort)
2011,2007,2005,2004,2003,2000,1997,1994,1993,1992,1991,1990,1989,1986,1981,1980,1979,1978,1977,1976,1974
Download
Bibliothèque de statistiques globales →Jordan →

Persistence to grade 5, female (% of cohort)

Cette statistique dans les autres pays:

AfghanistanAlbaniaAlgeriaAndorraAngolaAntigua and BarbudaArab WorldArgentinaArubaBahamas, TheBahrainBangladeshBarbadosBelgiumBelizeBeninBermudaBhutanBoliviaBosnia and HerzegovinaBotswanaBrunei DarussalamBurkina FasoBurundiCabo VerdeCambodiaCameroonCanadaCaribbean small statesCayman IslandsCentral African RepublicChadChileChinaColombiaComorosCongo, Dem. Rep.Congo, Rep.Costa RicaCote d'IvoireCubaCyprusCzech RepublicDenmarkDjiboutiDominicaDominican RepublicEarly-demographic dividendEast Asia & PacificEast Asia & Pacific (excluding high income)East Asia & Pacific (IDA & IBRD countries)EcuadorEgypt, Arab Rep.El SalvadorEquatorial GuineaEritreaEstoniaEthiopiaFijiFinlandFranceGabonGambia, TheGeorgiaGhanaGreeceGrenadaGuatemalaGuineaGuinea-BissauGuyanaHaitiHeavily indebted poor countries (HIPC)HondurasHong Kong SAR, ChinaHungaryIcelandIDA blendIDA onlyIDA totalIndiaIndonesiaIran, Islamic Rep.IraqIrelandIsraelItalyJamaicaJapanJordanKenyaKiribatiKorea, Rep.KuwaitLao PDRLate-demographic dividendLatviaLeast developed countries: UN classificationLebanonLesothoLiberiaLibyaLiechtensteinLow incomeLower middle incomeLuxembourgMacao SAR, ChinaMadagascarMalawiMalaysiaMaldivesMaliMaltaMarshall IslandsMauritaniaMauritiusMexicoMiddle East & North AfricaMiddle East & North Africa (excluding high income)Middle East & North Africa (IDA & IBRD countries)MontenegroMoroccoMozambiqueMyanmarNamibiaNepalNetherlandsNicaraguaNigerNigeriaNorwayOmanOther small statesPacific island small statesPakistanPanamaPapua New GuineaParaguayPeruPhilippinesPolandPortugalPre-demographic dividendQatarRwandaSamoaSan MarinoSao Tome and PrincipeSaudi ArabiaSenegalSeychellesSierra LeoneSingaporeSloveniaSolomon IslandsSouth AfricaSouth AsiaSouth Asia (IDA & IBRD)SpainSri LankaSt. Kitts and NevisSt. LuciaSt. Vincent and the GrenadinesSub-Saharan Africa Sub-Saharan Africa (excluding high income)Sub-Saharan Africa (IDA & IBRD countries)SudanSurinameSwazilandSwedenSwitzerlandSyrian Arab RepublicTanzaniaThailandTimor-LesteTogoTongaTrinidad and TobagoTunisiaTurkeyUgandaUnited Arab EmiratesUpper middle incomeUruguayVanuatuVenezuela, RBVietnamYemen, Rep.ZambiaZimbabwe

La ligne de temps

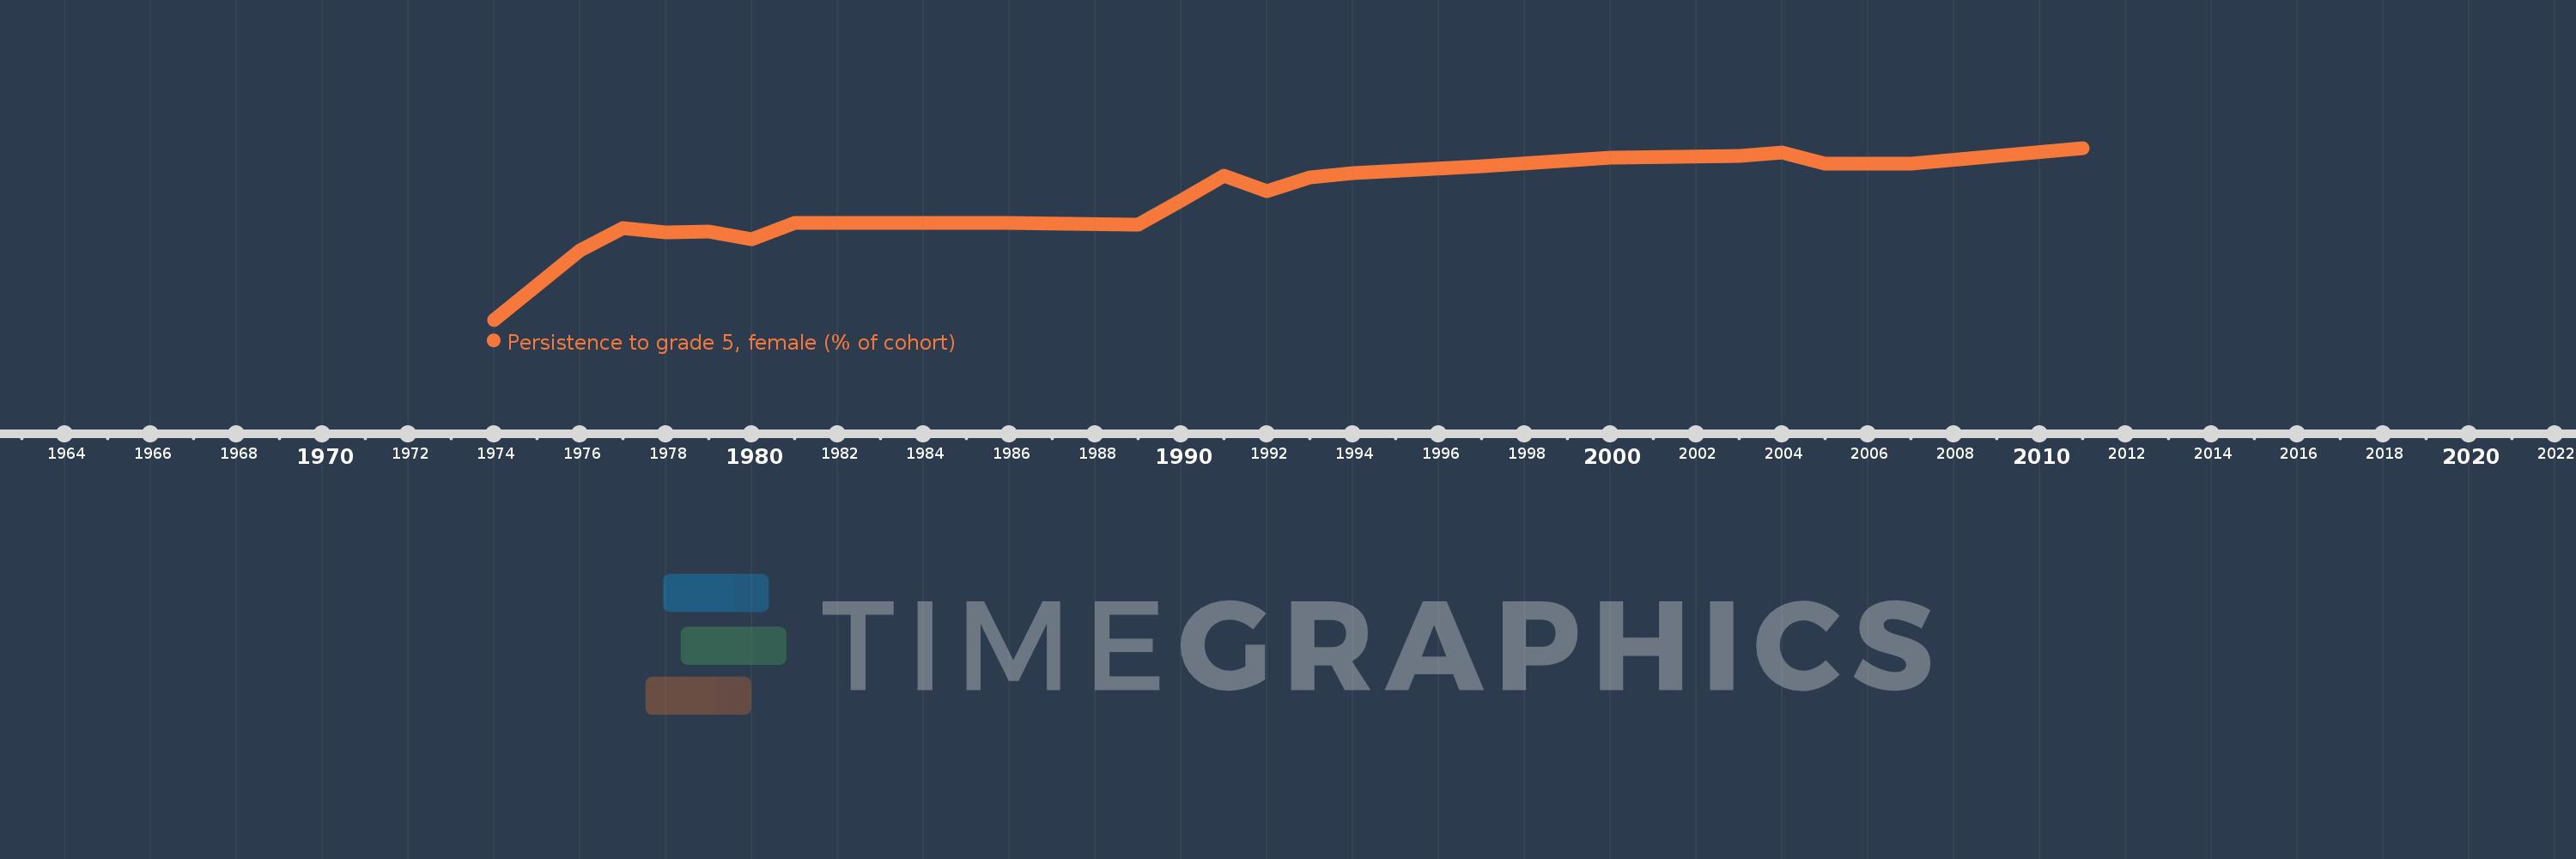
Cette échelle de temps montre un graphique de 1974 année à 2011 année Jordan. Les données jusqu'à 1973 année ne sont pas présentés. Quantité d'observations actuelles selon dates: 21.

Source (désignation):

Les indicateurs du développement mondiale

Source (organisation):

United Nations Educational, Scientific, and Cultural Organization (UNESCO) Institute for Statistics.

Catégories:

Education, Gender

Dernière mise à jour

23 avr. 2017

Les indicateurs de changement de valeurs selon les années

En moyenne:
86.628
Minimum:
57.282
1 janv. 1974
Maximum:
99.327
1 janv. 2011
Pour la date d''observation
Valeur
Changement absolu
Le changement par rapport à la valeur précédente
1 janv. 1974
57.282
+57.282
0.0%
1 janv. 1976
74.184
+16.901
29.51%
1 janv. 1977
79.779
+5.595
7.54%
1 janv. 1978
78.666
-1.113
-1.4%
1 janv. 1979
78.856
+0.19
0.24%
1 janv. 1980
77.062
-1.794
-2.27%
1 janv. 1981
80.985
+3.922
5.09%
1 janv. 1986
81.034
+0.05
0.06%
1 janv. 1989
80.556
-0.479
-0.59%
1 janv. 1990
86.532
+5.977
7.42%
1 janv. 1991
92.437
+5.905
6.82%
1 janv. 1992
88.706
-3.73
-4.04%
1 janv. 1993
92.119
+3.413
3.85%
1 janv. 1994
93.112
+0.993
1.08%
1 janv. 1997
94.799
+1.688
1.81%
1 janv. 2000
97.0
+2.2
2.32%
1 janv. 2003
97.465
+0.465
0.48%
1 janv. 2004
98.223
+0.757
0.78%
1 janv. 2005
95.522
-2.7
-2.75%
1 janv. 2007
95.535
+0.012
0.01%
1 janv. 2011
99.327
+3.793
3.97%

Classement des pays selon les statistiques actuelles par années