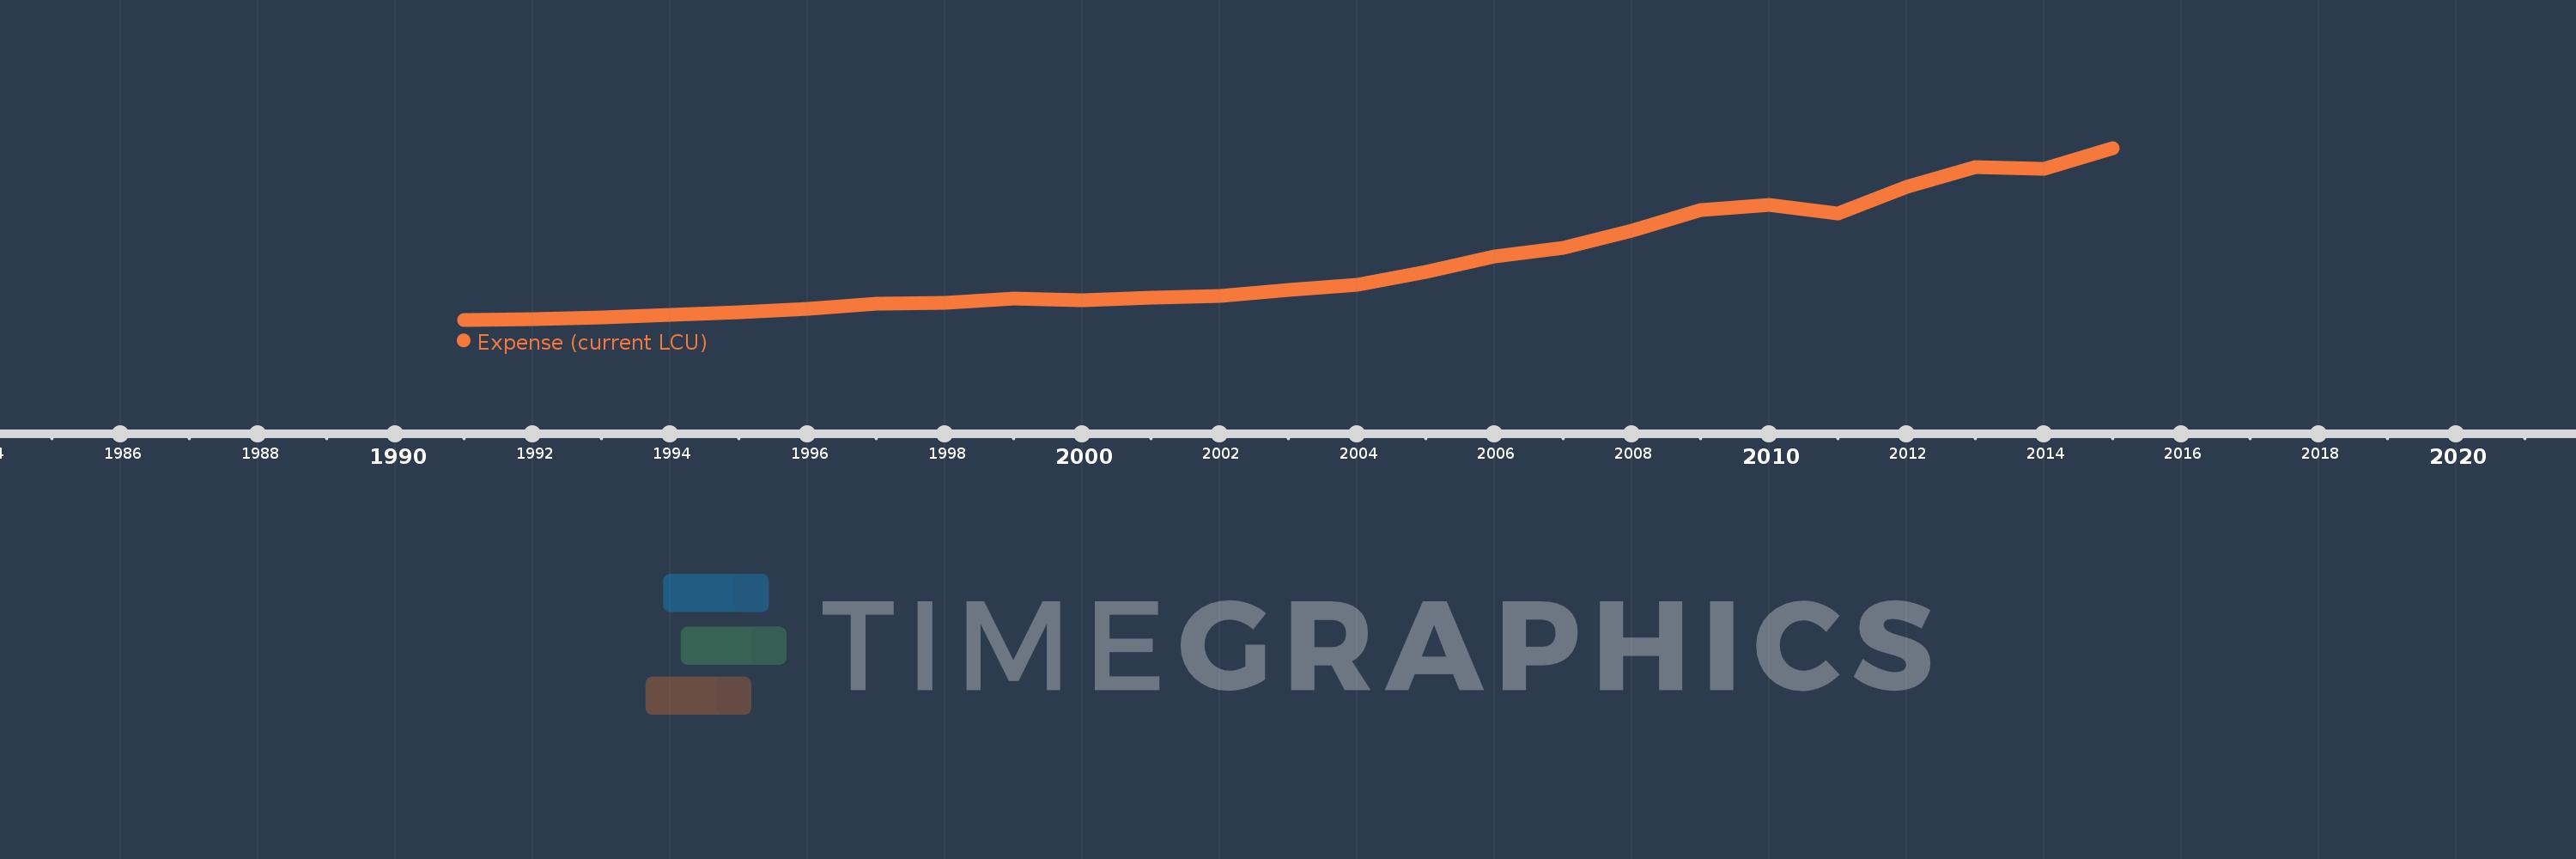
Cette échelle de temps montre un graphique de 1991 année à 2015 année Jordan. Les données jusqu'à 1990 année ne sont pas présentés. Quantité d'observations actuelles selon dates: 25.
Source (désignation):
Les indicateurs du développement mondiale
Source (organisation):
International Monetary Fund, Government Finance Statistics Yearbook and data files.
Catégories:
Public Sector
Dernière mise à jour
23 avr. 2017
Les indicateurs de changement de valeurs selon les années
En moyenne:
2.931 mds
Minimum:
819.76 mln.
1 janv. 1991
Maximum:
7.191 mds
1 janv. 2015
Pour la date d''observation
Valeur
Changement absolu
Le changement par rapport à la valeur précédente
1 janv. 1991
819.76 mln.
+819.76 mln.
0.0%
1 janv. 1992
856.54 mln.
+36.78 mln.
4.49%
1 janv. 1993
891.25 mln.
+34.71 mln.
4.05%
1 janv. 1994
1.006 mds
+114.64 mln.
12.86%
1 janv. 1995
1.086 mds
+80.3 mln.
7.98%
1 janv. 1996
1.232 mds
+146.23 mln.
13.46%
1 janv. 1997
1.415 mds
+182.51 mln.
14.81%
1 janv. 1998
1.46 mds
+45.09 mln.
3.19%
1 janv. 1999
1.6 mds
+139.71 mln.
9.57%
1 janv. 2000
1.547 mds
-52.84 mln.
-3.3%
1 janv. 2001
1.627 mds
+79.91 mln.
5.17%
1 janv. 2002
1.717 mds
+90.63 mln.
5.57%
1 janv. 2003
1.925 mds
+207.77 mln.
12.1%
1 janv. 2004
2.13 mds
+204.81 mln.
10.64%
1 janv. 2005
2.6 mds
+470.23 mln.
22.08%
1 janv. 2006
3.182 mds
+581.56 mln.
22.37%
1 janv. 2007
3.497 mds
+314.78 mln.
9.89%
1 janv. 2008
4.111 mds
+614.02 mln.
17.56%
1 janv. 2009
4.899 mds
+788.7 mln.
19.19%
1 janv. 2010
5.09 mds
+190.3 mln.
3.88%
1 janv. 2011
4.747 mds
-343.0 mln.
-6.74%
1 janv. 2012
5.74 mds
+992.94 mln.
20.92%
1 janv. 2013
6.485 mds
+745.86 mln.
13.0%
1 janv. 2014
6.419 mds
-66.4 mln.
-1.02%
1 janv. 2015
7.191 mds
+772.3 mln.
12.03%
Classement des pays selon les statistiques actuelles par années