30
/fr/
AIzaSyAYiBZKx7MnpbEhh9jyipgxe19OcubqV5w
April 1, 2024
163176
Jamaica
JAM
true
2
1
Prevalence of wasting, weight for height (% of children under 5)
2013,2011,2009,2008,2007,2005,2003,2002,2001,2000,1999,1998,1997,1996,1995,1994,1993,1992,1990,1979
Download
Bibliothèque de statistiques globales →Jamaica →

Prevalence of wasting, weight for height (% of children under 5)

Cette statistique dans les autres pays:

AfghanistanAlbaniaAlgeriaAngolaArgentinaArmeniaAustraliaAzerbaijanBahrainBangladeshBarbadosBelarusBelizeBeninBhutanBoliviaBosnia and HerzegovinaBotswanaBrazilBrunei DarussalamBulgariaBurkina FasoBurundiCabo VerdeCambodiaCameroonCanadaCentral African RepublicChadChileChinaColombiaComorosCongo, Dem. Rep.Congo, Rep.Costa RicaCote d'IvoireCroatiaCubaCzech RepublicDjiboutiDominican RepublicEast Asia & PacificEast Asia & Pacific (excluding high income)EcuadorEgypt, Arab Rep.El SalvadorEquatorial GuineaEritreaEthiopiaEurope & Central AsiaEurope & Central Asia (excluding high income)FijiFragile and conflict affected situationsGabonGambia, TheGeorgiaGermanyGhanaGreeceGuatemalaGuineaGuinea-BissauGuyanaHaitiHigh incomeHondurasHungaryIDA & IBRD totalIDA totalIndiaIndonesiaIran, Islamic Rep.IraqItalyJamaicaJapanJordanKazakhstanKenyaKiribatiKorea, Dem. People’s Rep.Korea, Rep.KuwaitKyrgyz RepublicLao PDRLatin America & Caribbean Latin America & Caribbean (excluding high income)LebanonLesothoLiberiaLibyaLow & middle incomeLow incomeLower middle incomeMacedonia, FYRMadagascarMalawiMalaysiaMaldivesMaliMauritaniaMauritiusMexicoMiddle East & North AfricaMiddle East & North Africa (excluding high income)Middle incomeMoldovaMongoliaMontenegroMoroccoMozambiqueMyanmarNamibiaNauruNepalNetherlandsNicaraguaNigerNigeriaNorth AmericaOmanPakistanPanamaPapua New GuineaParaguayPeruPhilippinesQatarRomaniaRwandaSamoaSao Tome and PrincipeSaudi ArabiaSenegalSerbiaSeychellesSierra LeoneSingaporeSolomon IslandsSomaliaSouth AfricaSouth AsiaSouth SudanSri LankaSt. LuciaSub-Saharan Africa Sub-Saharan Africa (excluding high income)SudanSurinameSwazilandSyrian Arab RepublicTajikistanTanzaniaThailandTimor-LesteTogoTongaTrinidad and TobagoTunisiaTurkeyTurkmenistanTuvaluUgandaUkraineUnited KingdomUnited StatesUpper middle incomeUruguayUzbekistanVanuatuVenezuela, RBVietnamWest Bank and GazaWorldYemen, Rep.ZambiaZimbabwe

La ligne de temps

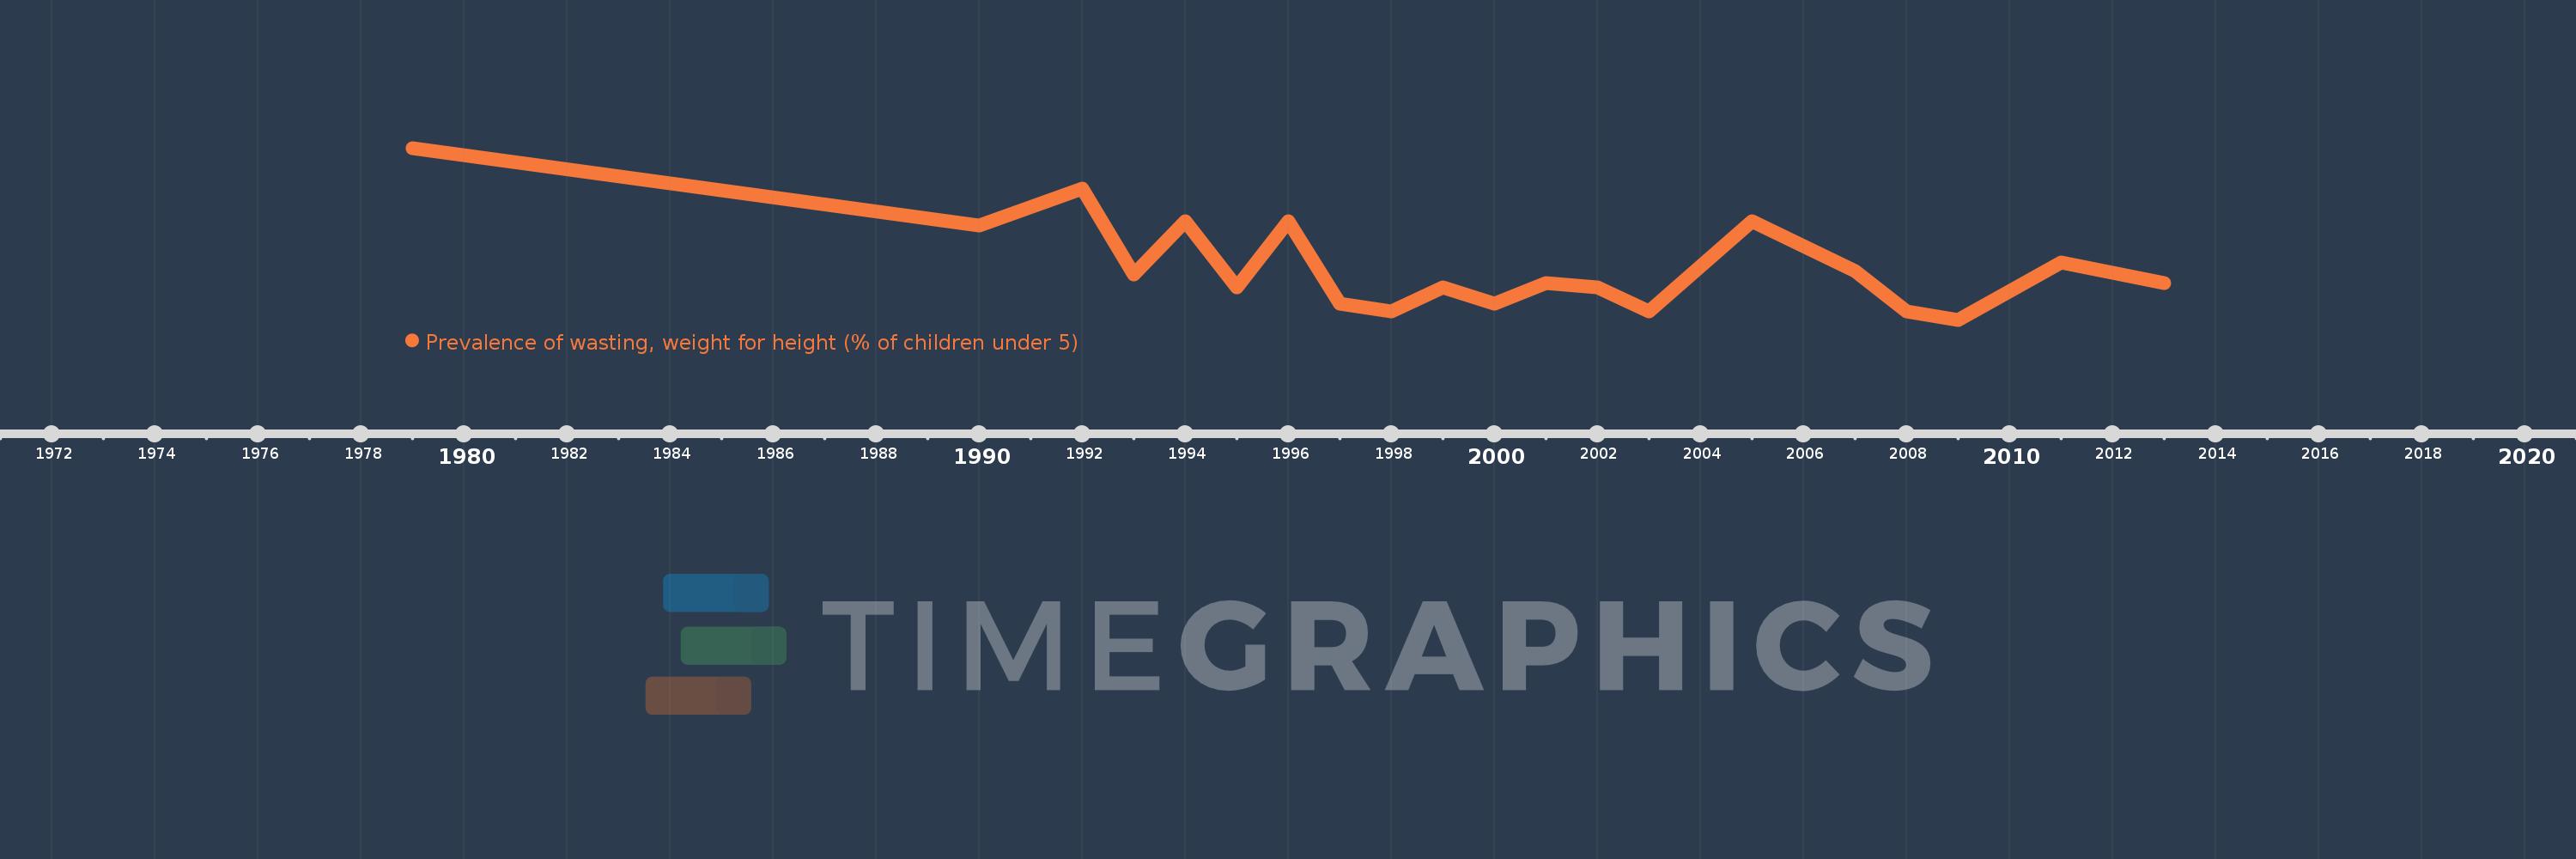
Cette échelle de temps montre un graphique de 1979 année à 2013 année Jamaica. Les données jusqu'à 1978 année ne sont pas présentés. Quantité d'observations actuelles selon dates: 20.

Source (désignation):

Les indicateurs du développement mondiale

Source (organisation):

World Health Organization, Global Database on Child Growth and Malnutrition. Country-level data are unadjusted data from national surveys, and thus may not be comparable across countries. Adjusted, comparable data are available at http://www.who.int/nutgrowthdb/en. Aggregation is based on UNICEF, WHO, and the World Bank harmonized dataset (adjusted, comparable data) and methodology.

Catégories:

Health

Dernière mise à jour

23 avr. 2017

Les indicateurs de changement de valeurs selon les années

En moyenne:
3.41
Minimum:
2.1
1 janv. 2009
Maximum:
6.3
1 janv. 1979
Pour la date d''observation
Valeur
Changement absolu
Le changement par rapport à la valeur précédente
1 janv. 1979
6.3
+6.3
0.0%
1 janv. 1990
4.4
-1.9
-30.16%
1 janv. 1992
5.3
+0.9
20.45%
1 janv. 1993
3.2
-2.1
-39.62%
1 janv. 1994
4.5
+1.3
40.62%
1 janv. 1995
2.9
-1.6
-35.56%
1 janv. 1996
4.5
+1.6
55.17%
1 janv. 1997
2.5
-2.0
-44.44%
1 janv. 1998
2.3
-0.2
-8.0%
1 janv. 1999
2.9
+0.6
26.09%
1 janv. 2000
2.5
-0.4
-13.79%
1 janv. 2001
3.0
+0.5
20.0%
1 janv. 2002
2.9
-0.1
-3.33%
1 janv. 2003
2.3
-0.6
-20.69%
1 janv. 2005
4.5
+2.2
95.65%
1 janv. 2007
3.3
-1.2
-26.67%
1 janv. 2008
2.3
-1.0
-30.3%
1 janv. 2009
2.1
-0.2
-8.7%
1 janv. 2011
3.5
+1.4
66.67%
1 janv. 2013
3.0
-0.5
-14.29%

Classement des pays selon les statistiques actuelles par années