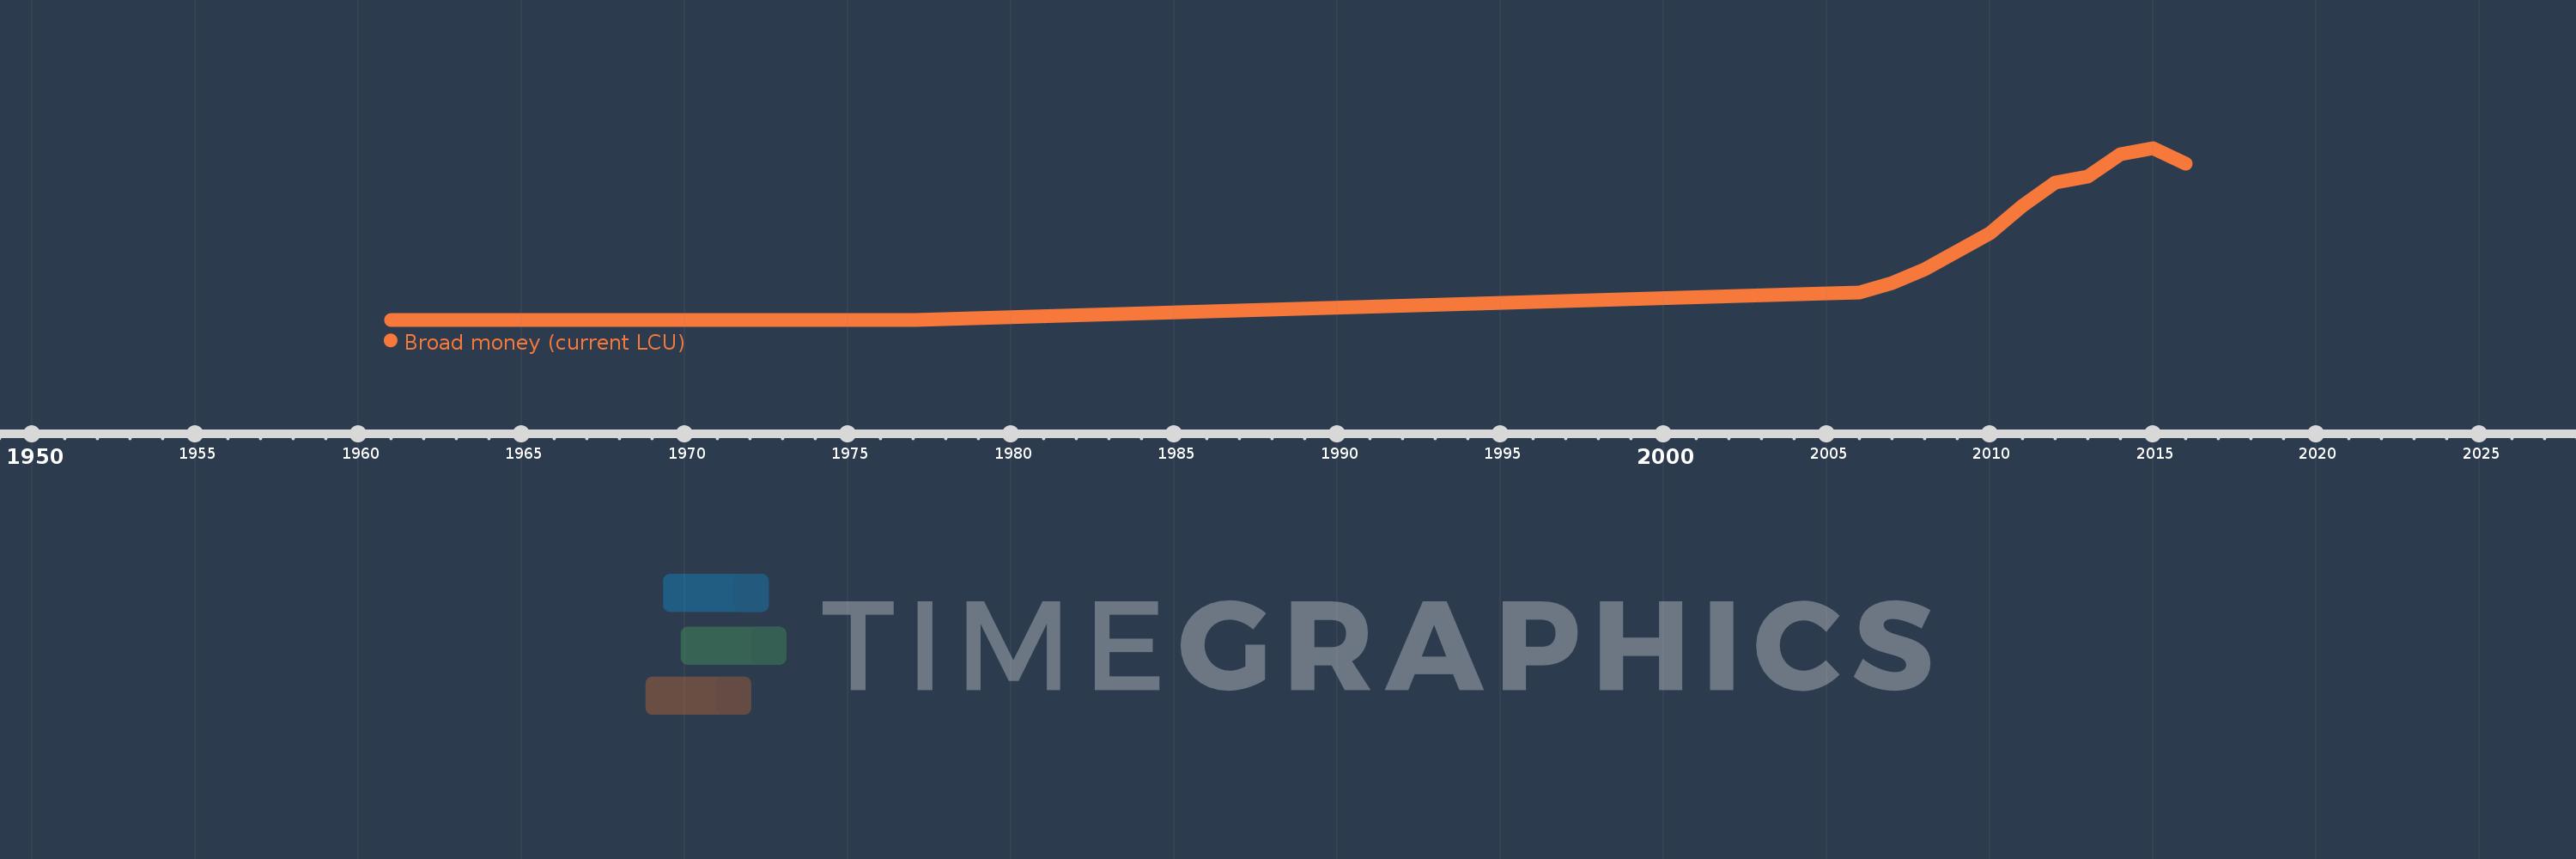
Cette échelle de temps montre un graphique de 1961 année à 2016 année Iraq. Les données jusqu'à 1960 année ne sont pas présentés. Quantité d'observations actuelles selon dates: 29.
Source (désignation):
Les indicateurs du développement mondiale
Source (organisation):
International Monetary Fund, International Financial Statistics and data files.
Catégories:
Financial Sector
Dernière mise à jour
23 avr. 2017
Les indicateurs de changement de valeurs selon les années
En moyenne:
22.039 billions
Minimum:
132.1 mln.
1 janv. 1961
Maximum:
92.638 billions
1 janv. 2015
Pour la date d''observation
Valeur
Changement absolu
Le changement par rapport à la valeur précédente
1 janv. 1961
132.1 mln.
+132.1 mln.
0.0%
1 janv. 1962
136.4 mln.
+4.3 mln.
3.26%
1 janv. 1963
148.0 mln.
+11.6 mln.
8.5%
1 janv. 1964
163.6 mln.
+15.6 mln.
10.54%
1 janv. 1965
166.6 mln.
+3.0 mln.
1.83%
1 janv. 1966
197.33 mln.
+30.73 mln.
18.45%
1 janv. 1967
212.34 mln.
+15.01 mln.
7.61%
1 janv. 1968
225.14 mln.
+12.8 mln.
6.03%
1 janv. 1969
248.4 mln.
+23.26 mln.
10.33%
1 janv. 1970
284.38 mln.
+35.98 mln.
14.48%
1 janv. 1971
298.98 mln.
+14.6 mln.
5.13%
1 janv. 1972
321.12 mln.
+22.14 mln.
7.41%
1 janv. 1973
364.3 mln.
+43.18 mln.
13.45%
1 janv. 1974
457.61 mln.
+93.31 mln.
25.61%
1 janv. 1975
652.22 mln.
+194.61 mln.
42.53%
1 janv. 1976
906.58 mln.
+254.36 mln.
39.0%
1 janv. 1977
1.105 mds
+198.01 mln.
21.84%
1 janv. 2005
14.356 billions
+14.355 billions
1.3 mln.%
1 janv. 2006
14.888 billions
+532.114 mds
3.71%
1 janv. 2007
19.92 billions
+5.032 billions
33.8%
1 janv. 2008
27.312 billions
+7.391 billions
37.11%
1 janv. 2009
36.93 billions
+9.618 billions
35.22%
1 janv. 2010
46.791 billions
+9.862 billions
26.7%
1 janv. 2011
61.393 billions
+14.602 billions
31.21%
1 janv. 2012
74.098 billions
+12.705 billions
20.69%
1 janv. 2013
77.142 billions
+3.044 billions
4.11%
1 janv. 2014
89.379 billions
+12.237 billions
15.86%
1 janv. 2015
92.638 billions
+3.259 billions
3.65%
1 janv. 2016
84.272 billions
-8.366 billions
-9.03%
Classement des pays selon les statistiques actuelles par années