29
/fr/
fr
AIzaSyAYiBZKx7MnpbEhh9jyipgxe19OcubqV5w
April 1, 2024
158225
Iraq
IRQ
true
2
1
Bank liquid reserves to bank assets ratio (%)
2016,2015,2014,2013,2012,2011,2010,2009,2008,2007,2006,2005
Download
Bibliothèque de statistiques globales →Iraq →

Bank liquid reserves to bank assets ratio (%)

Cette statistique dans les autres pays:
AfghanistanAlbaniaAlgeriaAngolaAntigua and BarbudaArab WorldArmeniaAustraliaAzerbaijanBangladeshBarbadosBelarusBelizeBeninBhutanBoliviaBosnia and HerzegovinaBotswanaBrazilBrunei DarussalamBulgariaBurkina FasoBurundiCabo VerdeCambodiaCameroonCanadaCaribbean small statesCentral African RepublicCentral Europe and the BalticsChadChileColombiaComorosCongo, Dem. Rep.Congo, Rep.Costa RicaCote d'IvoireCroatiaCzech RepublicDenmarkDominicaDominican RepublicEarly-demographic dividendEast Asia & Pacific (excluding high income)East Asia & Pacific (IDA & IBRD countries)Egypt, Arab Rep.Equatorial GuineaEritreaEurope & Central Asia (excluding high income)Europe & Central Asia (IDA & IBRD countries)FijiFragile and conflict affected situationsGabonGambia, TheGeorgiaGhanaGrenadaGuatemalaGuinea-BissauGuyanaHaitiHeavily indebted poor countries (HIPC)HondurasHungaryIBRD onlyIcelandIDA & IBRD totalIDA blendIDA onlyIDA totalIndonesiaIraqIsraelJamaicaJapanKazakhstanKenyaKorea, Rep.KosovoKuwaitKyrgyz RepublicLate-demographic dividendLatin America & Caribbean Latin America & Caribbean (excluding high income)Latin America & the Caribbean (IDA & IBRD countries)Least developed countries: UN classificationLesothoLow & middle incomeLow incomeLower middle incomeMacao SAR, ChinaMacedonia, FYRMalaysiaMaldivesMaliMauritiusMexicoMiddle incomeMoldovaMongoliaMoroccoMozambiqueMyanmarNamibiaNepalNicaraguaNigerNigeriaNorwayOmanOther small statesPakistanPanamaPapua New GuineaParaguayPhilippinesPolandPre-demographic dividendQatarRomaniaRussian FederationRwandaSamoaSao Tome and PrincipeSenegalSerbiaSeychellesSierra LeoneSmall statesSolomon IslandsSouth AfricaSouth AsiaSouth Asia (IDA & IBRD)South SudanSri LankaSt. Kitts and NevisSt. LuciaSt. Vincent and the GrenadinesSub-Saharan Africa Sub-Saharan Africa (excluding high income)Sub-Saharan Africa (IDA & IBRD countries)SudanSurinameSwazilandSwedenSyrian Arab RepublicTajikistanTanzaniaThailandTogoTongaTrinidad and TobagoTurkeyUgandaUkraineUnited Arab EmiratesUpper middle incomeUruguayVanuatuVenezuela, RBWorldZambia
La ligne de temps
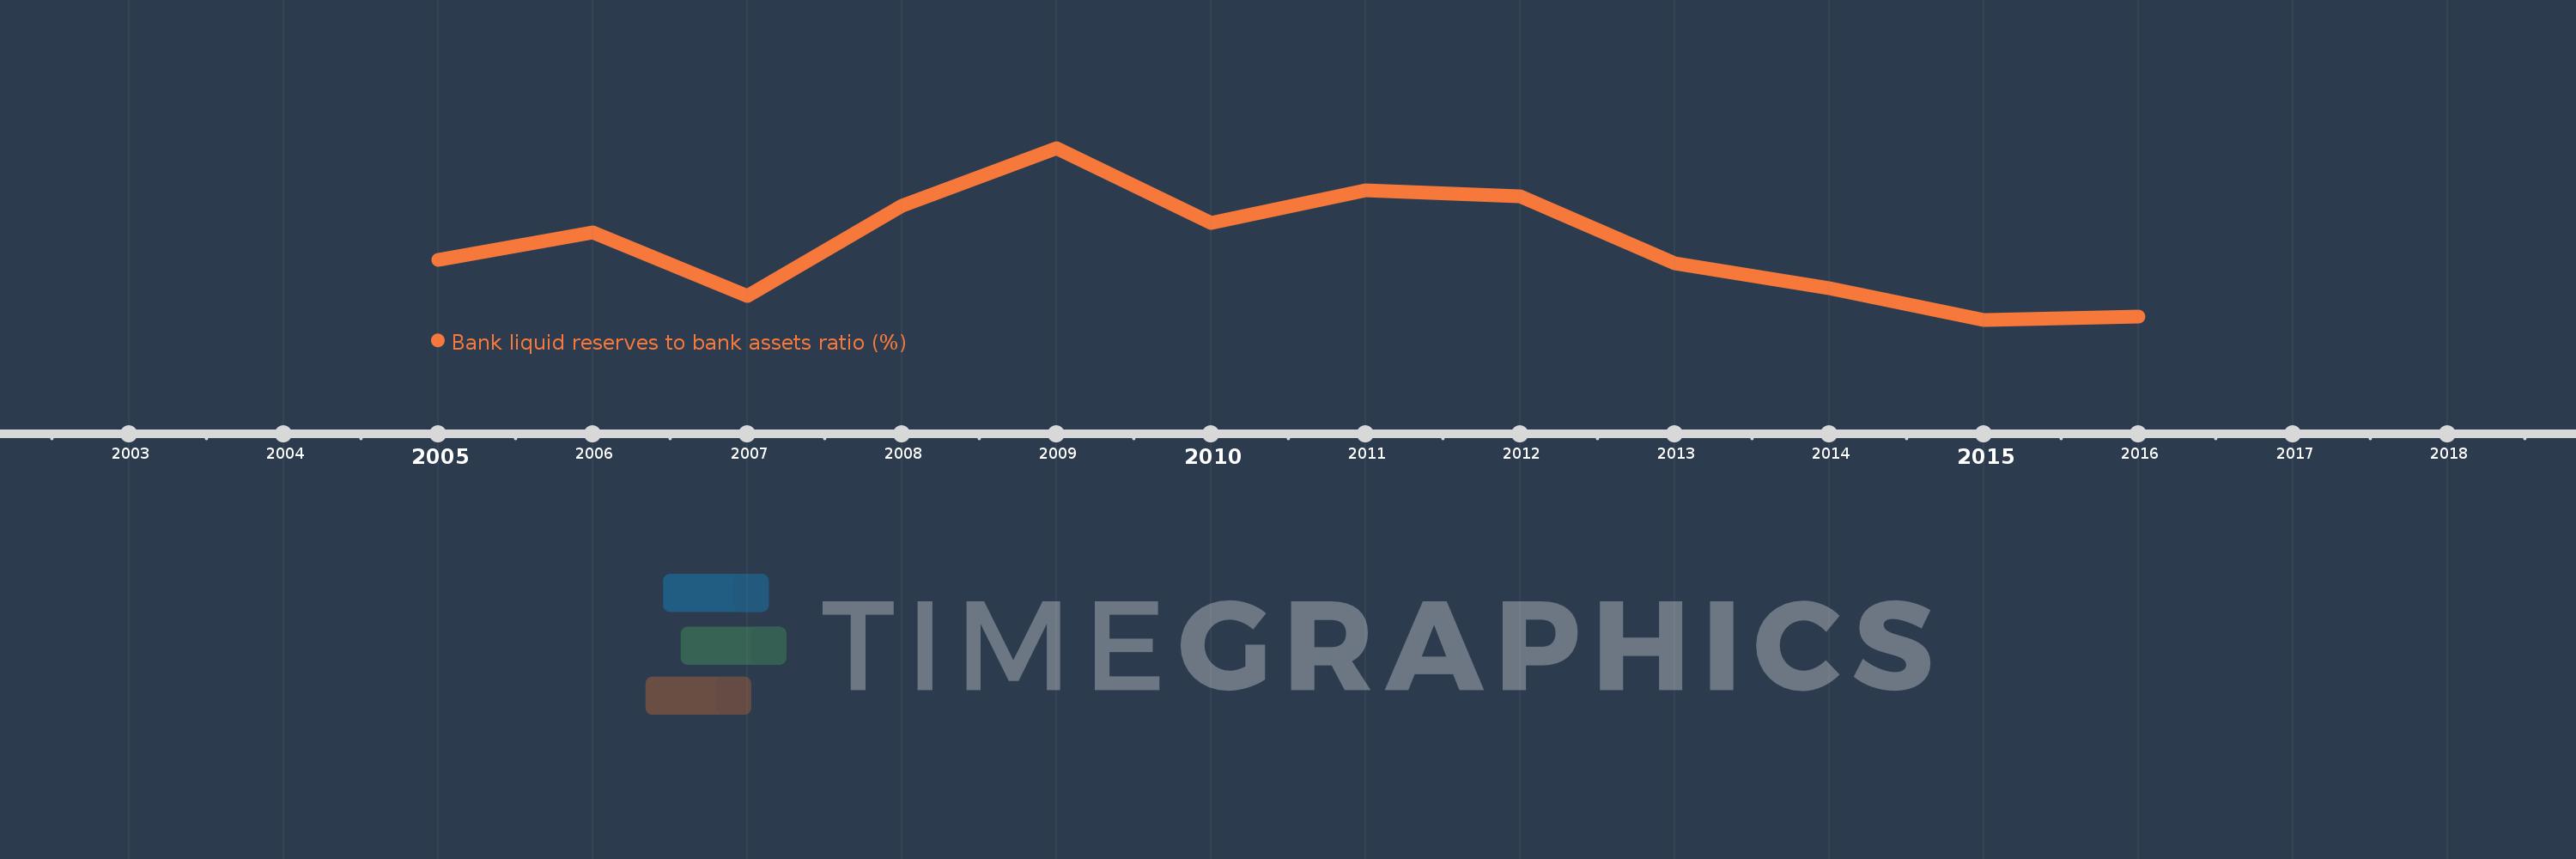
Cette échelle de temps montre un graphique de 2005 année à 2016 année Iraq. Les données jusqu'à 2004 année ne sont pas présentés. Quantité d'observations actuelles selon dates: 12.
Source (désignation):
Les indicateurs du développement mondiale
Source (organisation):
International Monetary Fund, International Financial Statistics and data files.
Catégories:
Financial Sector
Dernière mise à jour
23 avr. 2017
Les indicateurs de changement de valeurs selon les années
En moyenne:
127.274
Minimum:
79.646
1 janv. 2015
Maximum:
188.947
1 janv. 2009
Pour la date d''observation
Valeur
Changement absolu
Le changement par rapport à la valeur précédente
1 janv. 2005
117.626
+117.626
0.0%
1 janv. 2006
135.093
+17.468
14.85%
1 janv. 2007
94.799
-40.294
-29.83%
1 janv. 2008
152.412
+57.613
60.77%
1 janv. 2009
188.947
+36.534
23.97%
1 janv. 2010
141.223
-47.723
-25.26%
1 janv. 2011
162.23
+21.007
14.87%
1 janv. 2012
158.378
-3.852
-2.37%
1 janv. 2013
115.505
-42.873
-27.07%
1 janv. 2014
99.679
-15.826
-13.7%
1 janv. 2015
79.646
-20.033
-20.1%
1 janv. 2016
81.749
+2.103
2.64%
Classement des pays selon les statistiques actuelles par années

Commentaires:

Envoyer
PremiumAbout & FeedbackUn accordConfidentialité
logo
© 2022 Selected Technologies LLC – Morgan Hill, California