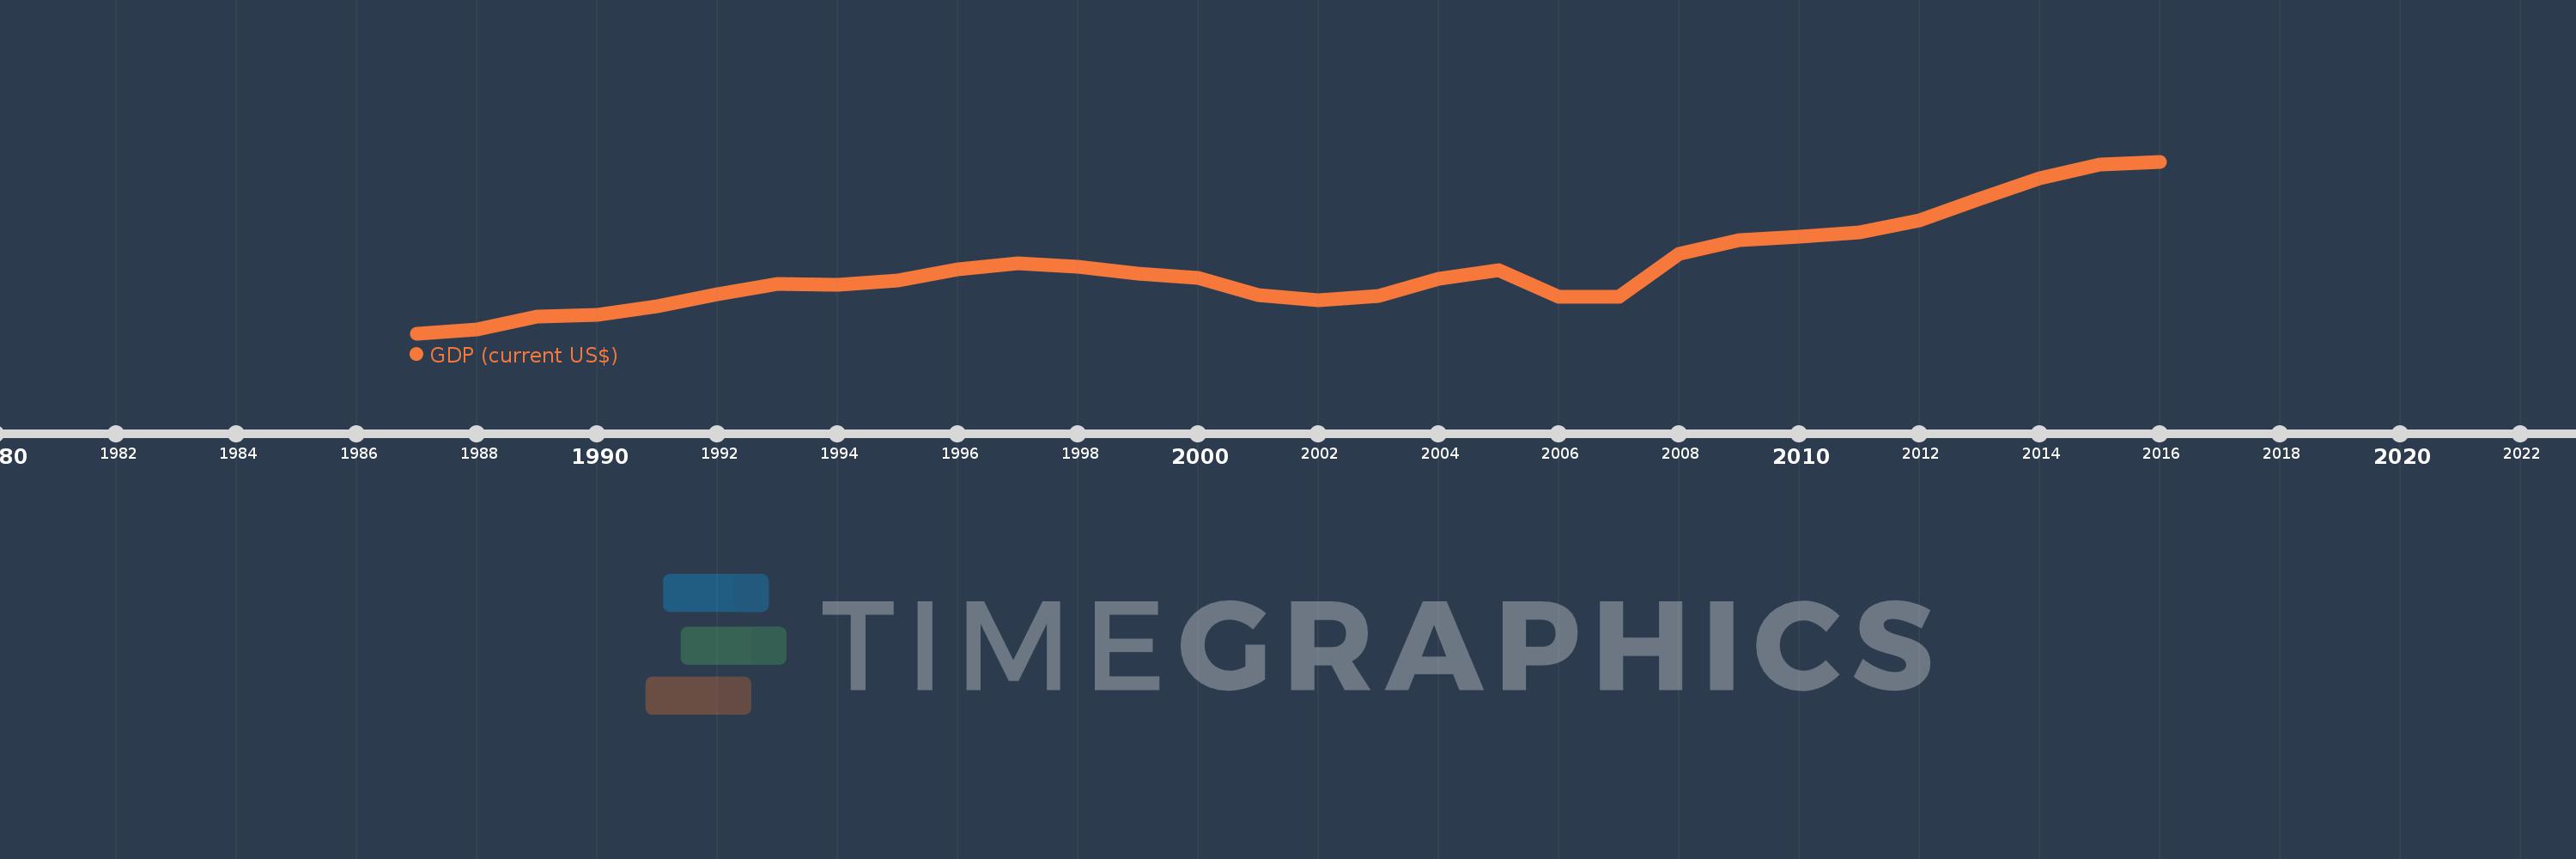
Cette échelle de temps montre un graphique de 1987 année à 2016 année Guinea. Les données jusqu'à 1986 année ne sont pas présentés. Quantité d'observations actuelles selon dates: 30.
Source (désignation):
Les indicateurs du développement mondiale
Source (organisation):
World Bank national accounts data, and OECD National Accounts data files.
Catégories:
Economy & Growth
Dernière mise à jour
23 avr. 2017
Les indicateurs de changement de valeurs selon les années
En moyenne:
3.762 mds
Minimum:
1.923 mds
1 janv. 1987
Maximum:
6.699 mds
1 janv. 2016
Pour la date d''observation
Valeur
Changement absolu
Le changement par rapport à la valeur précédente
1 janv. 1987
1.923 mds
+1.923 mds
0.0%
1 janv. 1988
2.042 mds
+118.937 mln.
6.19%
1 janv. 1989
2.384 mds
+342.758 mln.
16.79%
1 janv. 1990
2.432 mds
+47.734 mln.
2.0%
1 janv. 1991
2.667 mds
+234.587 mln.
9.65%
1 janv. 1992
3.015 mds
+348.274 mln.
13.06%
1 janv. 1993
3.285 mds
+269.735 mln.
8.95%
1 janv. 1994
3.279 mds
-5.562 mln.
-0.17%
1 janv. 1995
3.383 mds
+104.156 mln.
3.18%
1 janv. 1996
3.694 mds
+310.534 mln.
9.18%
1 janv. 1997
3.869 mds
+175.279 mln.
4.75%
1 janv. 1998
3.784 mds
-85.244 mln.
-2.2%
1 janv. 1999
3.588 mds
-195.412 mln.
-5.16%
1 janv. 2000
3.461 mds
-127.094 mln.
-3.54%
1 janv. 2001
2.995 mds
-465.921 mln.
-13.46%
1 janv. 2002
2.833 mds
-161.918 mln.
-5.41%
1 janv. 2003
2.95 mds
+116.194 mln.
4.1%
1 janv. 2004
3.446 mds
+496.805 mln.
16.84%
1 janv. 2005
3.666 mds
+219.907 mln.
6.38%
1 janv. 2006
2.937 mds
-729.277 mln.
-19.89%
1 janv. 2007
2.932 mds
-5.447 mln.
-0.19%
1 janv. 2008
4.134 mds
+1.203 mds
41.02%
1 janv. 2009
4.516 mds
+381.651 mln.
9.23%
1 janv. 2010
4.61 mds
+94.099 mln.
2.08%
1 janv. 2011
4.736 mds
+126.033 mln.
2.73%
1 janv. 2012
5.067 mds
+331.404 mln.
7.0%
1 janv. 2013
5.667 mds
+599.87 mln.
11.84%
1 janv. 2014
6.232 mds
+564.496 mln.
9.96%
1 janv. 2015
6.624 mds
+392.343 mln.
6.3%
1 janv. 2016
6.699 mds
+75.136 mln.
1.13%
Classement des pays selon les statistiques actuelles par années