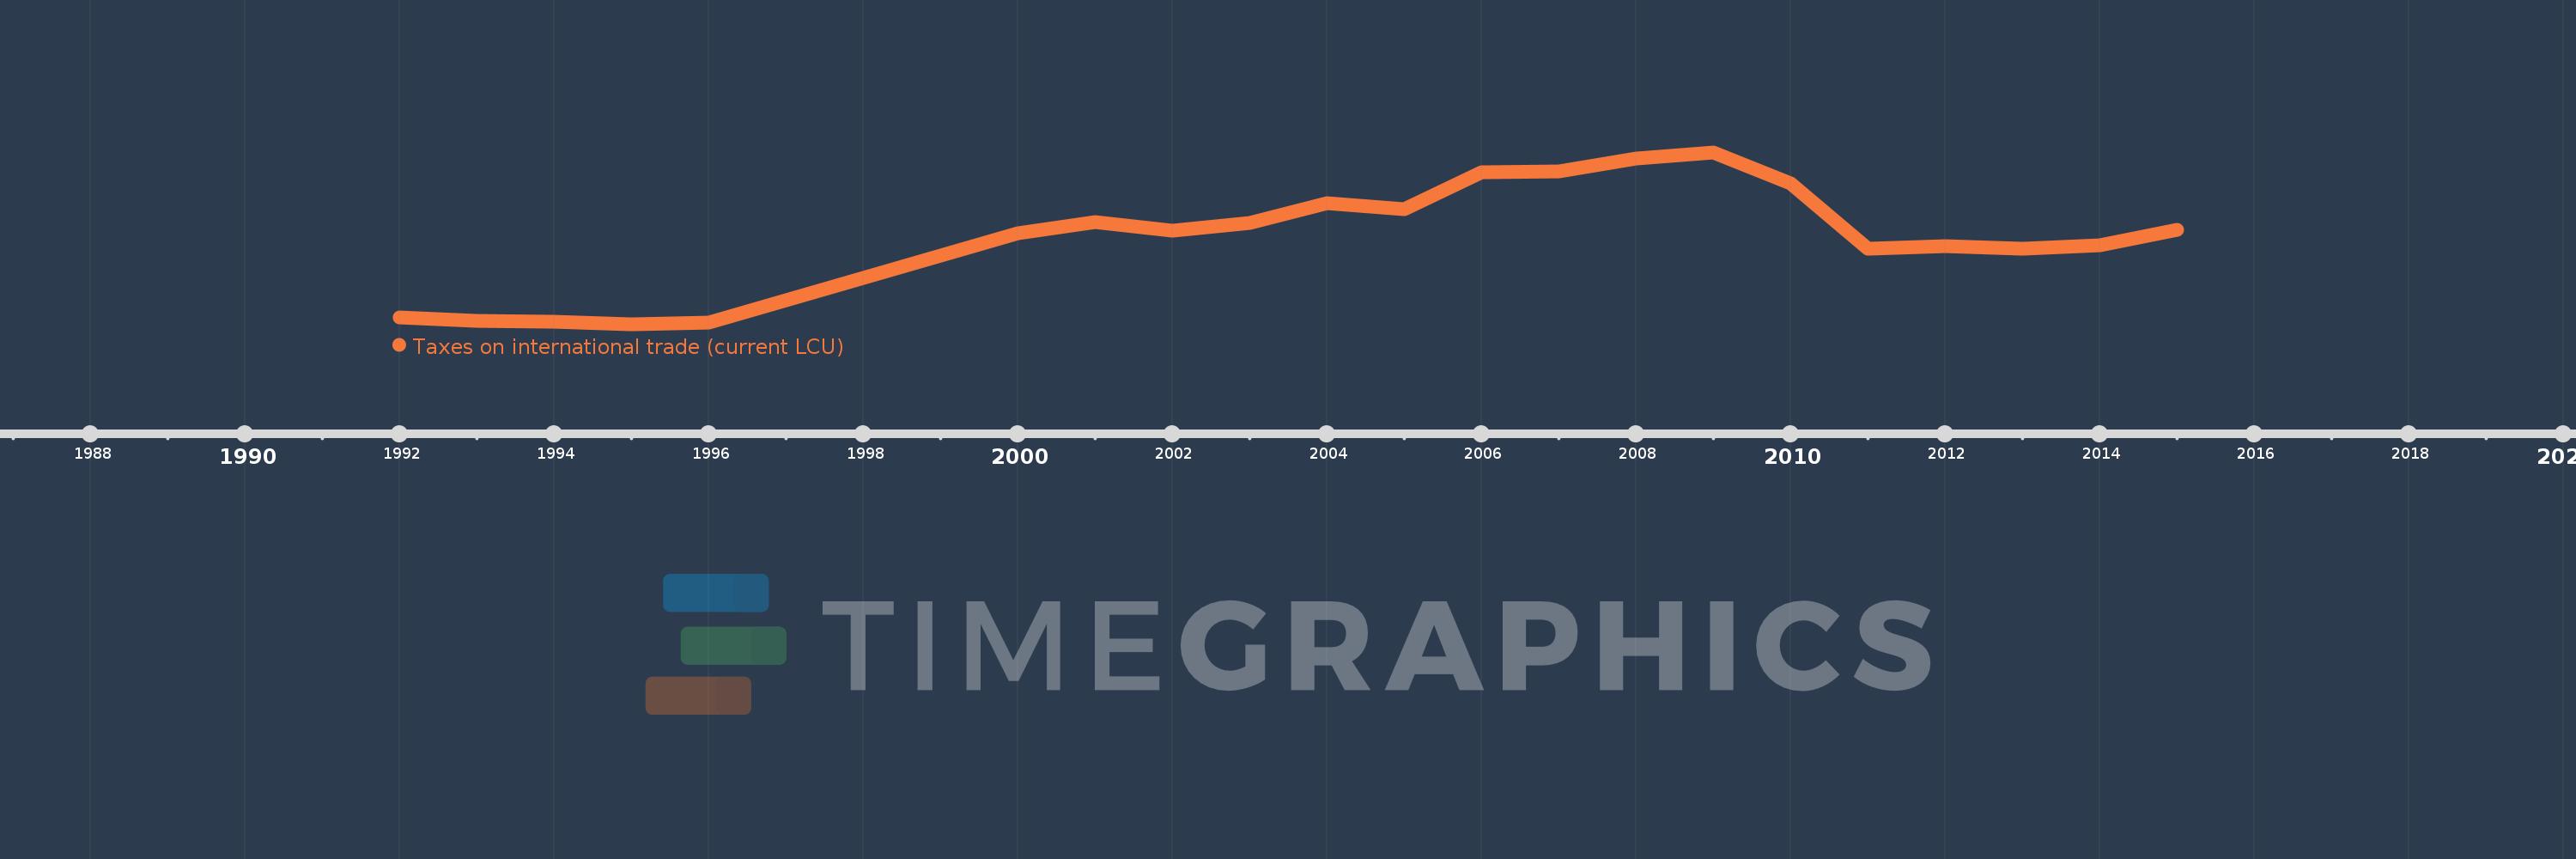
Cette échelle de temps montre un graphique de 1992 année à 2015 année Grenada. Les données jusqu'à 1991 année ne sont pas présentés. Quantité d'observations actuelles selon dates: 21.
Source (désignation):
Les indicateurs du développement mondiale
Source (organisation):
International Monetary Fund, Government Finance Statistics Yearbook and data files.
Catégories:
Public Sector
Dernière mise à jour
23 avr. 2017
Les indicateurs de changement de valeurs selon les années
En moyenne:
134.654 mln.
Minimum:
32.54 mln.
1 janv. 1995
Maximum:
234.601 mln.
1 janv. 2009
Pour la date d''observation
Valeur
Changement absolu
Le changement par rapport à la valeur précédente
1 janv. 1992
40.57 mln.
+40.57 mln.
0.0%
1 janv. 1993
36.63 mln.
-3.94 mln.
-9.71%
1 janv. 1994
35.1 mln.
-1.53 mln.
-4.18%
1 janv. 1995
32.54 mln.
-2.56 mln.
-7.29%
1 janv. 1996
34.37 mln.
+1.83 mln.
5.62%
1 janv. 2000
139.9 mln.
+105.53 mln.
307.04%
1 janv. 2001
152.76 mln.
+12.86 mln.
9.19%
1 janv. 2002
142.32 mln.
-10.44 mln.
-6.83%
1 janv. 2003
151.29 mln.
+8.97 mln.
6.3%
1 janv. 2004
174.82 mln.
+23.53 mln.
15.55%
1 janv. 2005
168.12 mln.
-6.7 mln.
-3.83%
1 janv. 2006
210.872 mln.
+42.752 mln.
25.43%
1 janv. 2007
212.318 mln.
+1.446 mln.
0.69%
1 janv. 2008
227.685 mln.
+15.367 mln.
7.24%
1 janv. 2009
234.601 mln.
+6.916 mln.
3.04%
1 janv. 2010
197.894 mln.
-36.707 mln.
-15.65%
1 janv. 2011
121.118 mln.
-76.775 mln.
-38.8%
1 janv. 2012
124.434 mln.
+3.316 mln.
2.74%
1 janv. 2013
121.789 mln.
-2.645 mln.
-2.13%
1 janv. 2014
125.099 mln.
+3.31 mln.
2.72%
1 janv. 2015
143.495 mln.
+18.396 mln.
14.71%
Classement des pays selon les statistiques actuelles par années