33
/fr/
AIzaSyAYiBZKx7MnpbEhh9jyipgxe19OcubqV5w
August 1, 2025
141997
Greece
GRC
true
2
1
Labor force with secondary education (% of total)
2015,2014,2013,2012,2011,2010,2009,2008,2007,2006,2005,2004,2003,2002,2001,2000,1999,1998,1997,1996,1995,1994,1993
Download
Bibliothèque de statistiques globales →Greece →

Labor force with secondary education (% of total)

Cette statistique dans les autres pays:

AlbaniaAlgeriaAntigua and BarbudaArgentinaArmeniaArubaAustraliaAustriaAzerbaijanBahamas, TheBahrainBarbadosBelarusBelgiumBelizeBermudaBoliviaBosnia and HerzegovinaBotswanaBrazilBritish Virgin IslandsBulgariaCambodiaCanadaCayman IslandsCentral Europe and the BalticsChadChileColombiaCosta RicaCroatiaCubaCyprusCzech RepublicDenmarkDominicaDominican RepublicEarly-demographic dividendEcuadorEgypt, Arab Rep.El SalvadorEstoniaEthiopiaEuro areaEurope & Central AsiaEurope & Central Asia (excluding high income)Europe & Central Asia (IDA & IBRD countries)European UnionFinlandFranceFrench PolynesiaGeorgiaGermanyGhanaGreeceGuatemalaGuyanaHigh incomeHondurasHong Kong SAR, ChinaHungaryIcelandIndiaIndonesiaIran, Islamic Rep.IrelandIsraelItalyJapanJordanKazakhstanKorea, Rep.KosovoKuwaitKyrgyz RepublicLatin America & Caribbean Latin America & Caribbean (excluding high income)Latin America & the Caribbean (IDA & IBRD countries)LatviaLebanonLithuaniaLuxembourgMacao SAR, ChinaMacedonia, FYRMadagascarMalaysiaMaltaMauritiusMexicoMoldovaMongoliaMontenegroMoroccoNamibiaNepalNetherlandsNew CaledoniaNew ZealandNicaraguaNigerNigeriaNorth AmericaNorwayOECD membersOmanPakistanPanamaParaguayPeruPhilippinesPolandPortugalPost-demographic dividendRomaniaRussian FederationRwandaSan MarinoSaudi ArabiaSerbiaSingaporeSlovak RepublicSloveniaSouth AfricaSouth AsiaSouth Asia (IDA & IBRD)SpainSri LankaSt. Kitts and NevisSt. LuciaSt. Vincent and the GrenadinesSwedenSwitzerlandSyrian Arab RepublicTajikistanThailandTimor-LesteTrinidad and TobagoTunisiaTurkeyUgandaUkraineUnited Arab EmiratesUnited KingdomUnited StatesUruguayVenezuela, RBWest Bank and GazaYemen, Rep.

La ligne de temps

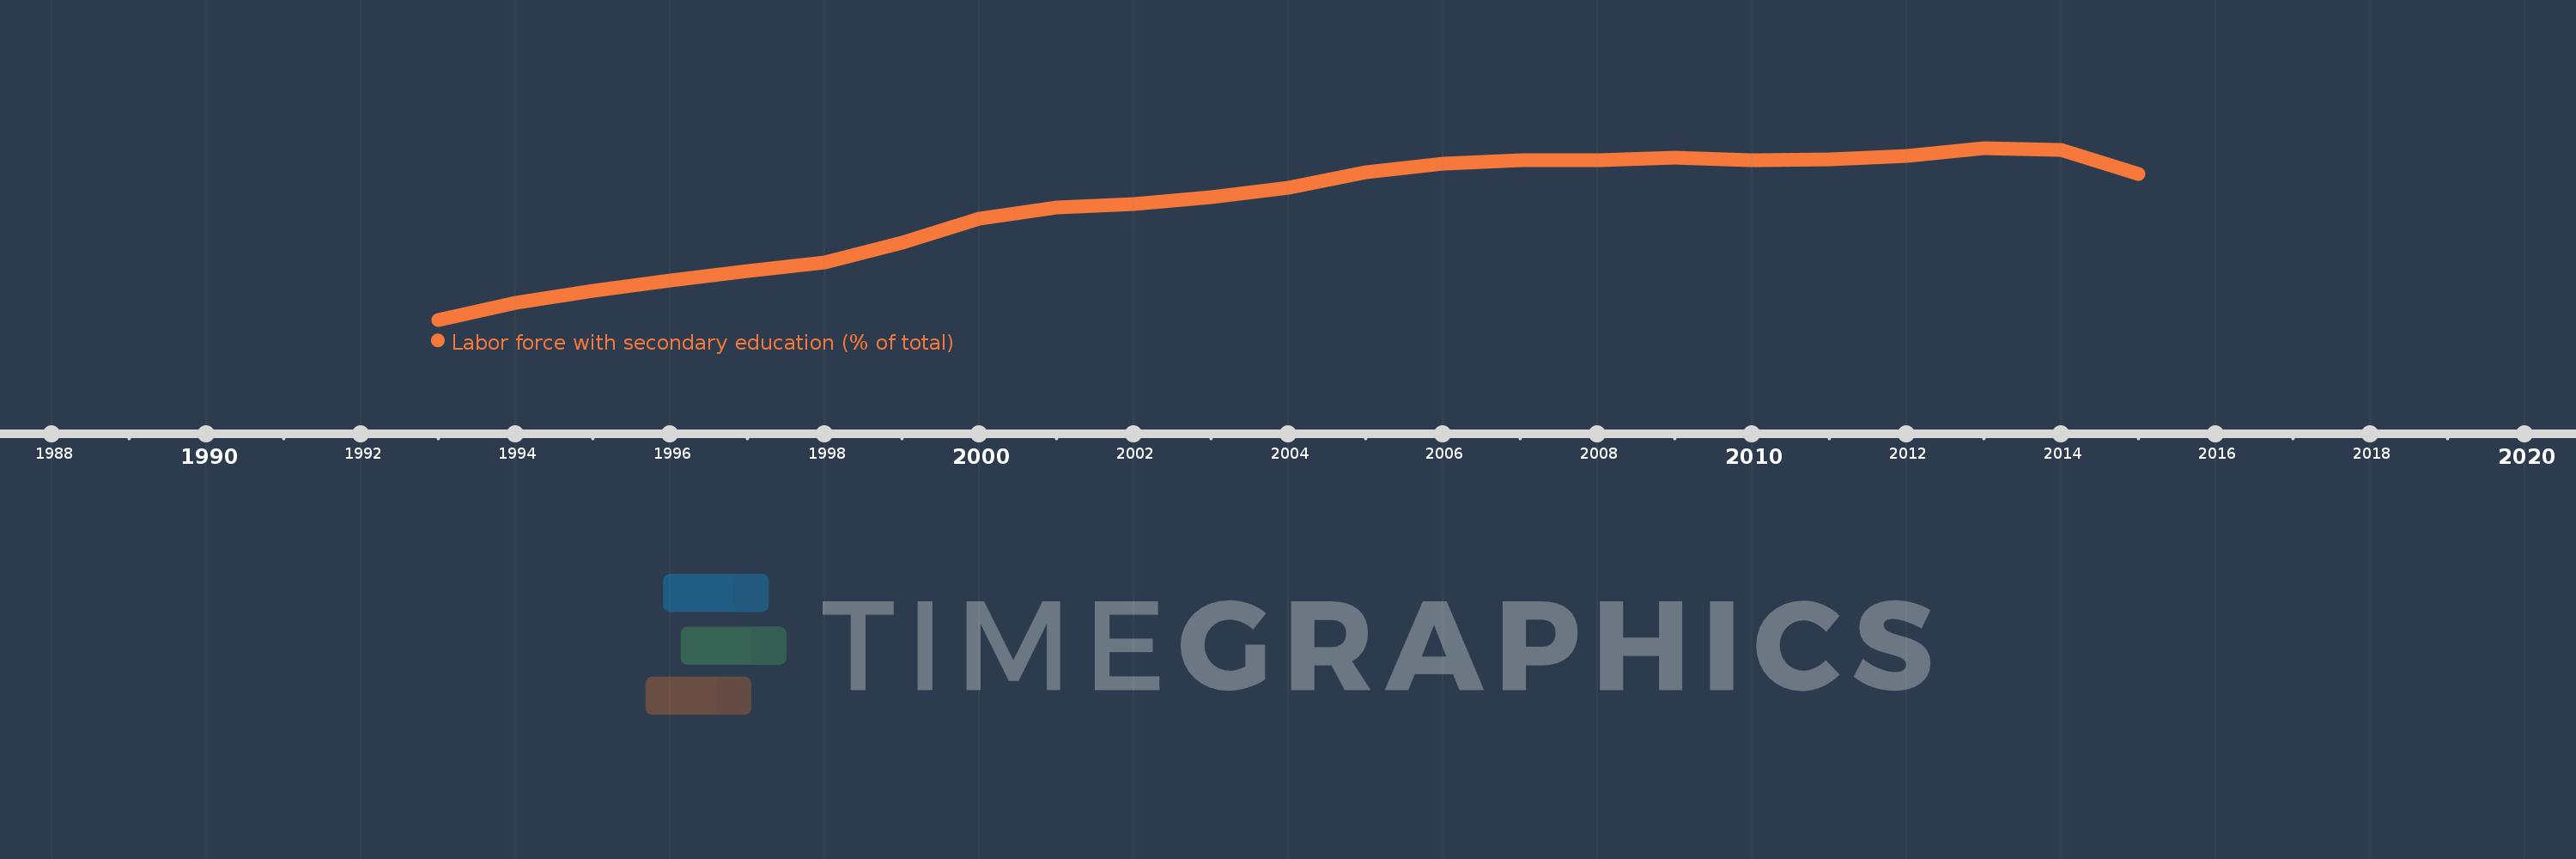
Cette échelle de temps montre un graphique de 1993 année à 2015 année Greece. Les données jusqu'à 1992 année ne sont pas présentés. Quantité d'observations actuelles selon dates: 23.

Source (désignation):

Les indicateurs du développement mondiale

Source (organisation):

International Labour Organization, Key Indicators of the Labour Market database.

Catégories:

Education, Social Protection & Labor

Dernière mise à jour

23 avr. 2017

Les indicateurs de changement de valeurs selon les années

En moyenne:
38.996
Minimum:
28.7
1 janv. 1993
Maximum:
44.3
1 janv. 2013
Pour la date d''observation
Valeur
Changement absolu
Le changement par rapport à la valeur précédente
1 janv. 1993
28.7
+28.7
0.0%
1 janv. 1994
30.2
+1.5
5.23%
1 janv. 1995
31.3
+1.1
3.64%
1 janv. 1996
32.3
+1.0
3.19%
1 janv. 1997
33.1
+0.8
2.48%
1 janv. 1998
33.9
+0.8
2.42%
1 janv. 1999
35.7
+1.8
5.31%
1 janv. 2000
37.9
+2.2
6.16%
1 janv. 2001
38.9
+1.0
2.64%
1 janv. 2002
39.2
+0.3
0.77%
1 janv. 2003
39.8
+0.6
1.53%
1 janv. 2004
40.7
+0.9
2.26%
1 janv. 2005
42.1
+1.4
3.44%
1 janv. 2006
42.9
+0.8
1.9%
1 janv. 2007
43.2
+0.3
0.7%
1 janv. 2008
43.2
0.0
0.0%
1 janv. 2009
43.4
+0.2
0.46%
1 janv. 2010
43.2
-0.2
-0.46%
1 janv. 2011
43.3
+0.1
0.23%
1 janv. 2012
43.6
+0.3
0.69%
1 janv. 2013
44.3
+0.7
1.61%
1 janv. 2014
44.1
-0.2
-0.45%
1 janv. 2015
41.9
-2.2
-4.99%

Classement des pays selon les statistiques actuelles par années