30
/fr/
AIzaSyAYiBZKx7MnpbEhh9jyipgxe19OcubqV5w
April 1, 2024
141575
Greece
GRC
true
2
1
Bound rate, simple mean, primary products (%)
2016,2015,2014,2013,2012,2011,2010,2009,2008,2007,2006,2005,2004,2003,2002,2001,2000,1999,1998,1997,1996
Download
Bibliothèque de statistiques globales →Greece →

Bound rate, simple mean, primary products (%)

Cette statistique dans les autres pays:

AlbaniaAngolaAntigua and BarbudaArgentinaArmeniaAustraliaAustriaBahrainBangladeshBarbadosBelgiumBelizeBeninBoliviaBotswanaBrazilBrunei DarussalamBulgariaBurkina FasoBurundiCabo VerdeCambodiaCameroonCanadaCentral African RepublicChadChileChinaColombiaCongo, Dem. Rep.Congo, Rep.Costa RicaCote d'IvoireCubaCyprusCzech RepublicDenmarkDjiboutiDominicaDominican RepublicEast Asia & Pacific (excluding high income)EcuadorEgypt, Arab Rep.El SalvadorEstoniaEurope & Central Asia (excluding high income)European UnionFijiFinlandFranceGabonGambia, TheGeorgiaGermanyGhanaGreeceGrenadaGuatemalaGuineaGuinea-BissauGuyanaHaitiHigh incomeHondurasHong Kong SAR, ChinaHungaryIcelandIndiaIndonesiaIrelandIsraelItalyJamaicaJapanJordanKenyaKorea, Rep.KuwaitKyrgyz RepublicLatin America & Caribbean (excluding high income)LatviaLesothoLithuaniaLow & middle incomeLow incomeLower middle incomeLuxembourgMacao SAR, ChinaMacedonia, FYRMadagascarMalawiMalaysiaMaldivesMaliMaltaMauritaniaMauritiusMexicoMiddle East & North Africa (excluding high income)Middle incomeMoldovaMongoliaMoroccoMozambiqueMyanmarNamibiaNepalNetherlandsNew ZealandNicaraguaNigerNigeriaNorwayOECD membersOmanPakistanPanamaPapua New GuineaParaguayPeruPhilippinesPolandPortugalQatarRomaniaRwandaSaudi ArabiaSenegalSierra LeoneSingaporeSlovak RepublicSloveniaSolomon IslandsSouth AfricaSouth AsiaSpainSri LankaSt. Kitts and NevisSt. LuciaSt. Vincent and the GrenadinesSub-Saharan Africa (excluding high income)SurinameSwazilandSwedenSwitzerlandTanzaniaThailandTogoTongaTrinidad and TobagoTunisiaTurkeyUgandaUkraineUnited Arab EmiratesUnited KingdomUnited StatesUpper middle incomeUruguayVenezuela, RBVietnamWorldZambiaZimbabwe

La ligne de temps

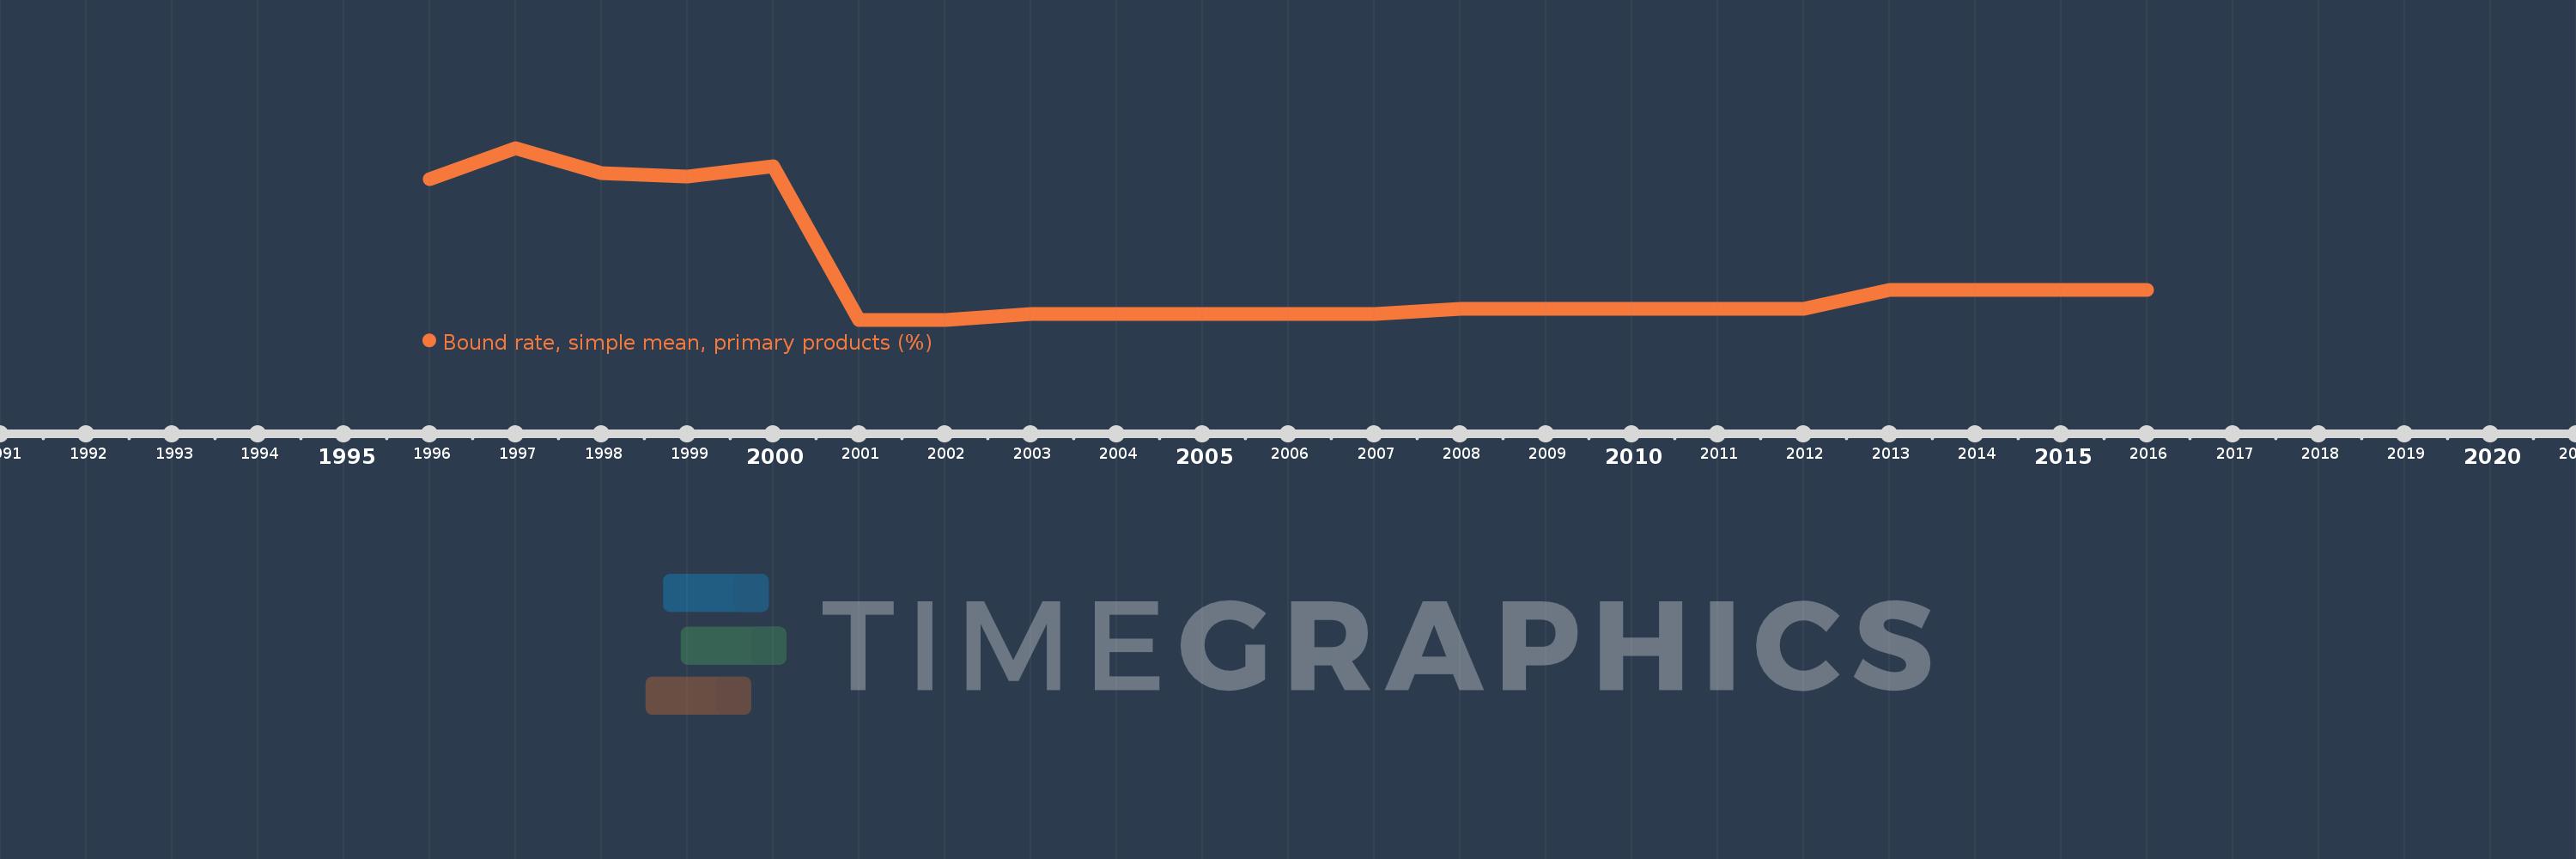
Cette échelle de temps montre un graphique de 1996 année à 2016 année Greece. Les données jusqu'à 1995 année ne sont pas présentés. Quantité d'observations actuelles selon dates: 21.

Source (désignation):

Les indicateurs du développement mondiale

Source (organisation):

World Bank staff estimates using the World Integrated Trade Solution system, based on data from World Trade Organization.

Catégories:

Private Sector, Trade

Dernière mise à jour

23 avr. 2017

Les indicateurs de changement de valeurs selon les années

En moyenne:
6.471
Minimum:
4.62
1 janv. 2001
Maximum:
11.62
1 janv. 1997
Pour la date d''observation
Valeur
Changement absolu
Le changement par rapport à la valeur précédente
1 janv. 1996
10.36
+10.36
0.0%
1 janv. 1997
11.62
+1.26
12.16%
1 janv. 1998
10.59
-1.03
-8.86%
1 janv. 1999
10.46
-0.13
-1.23%
1 janv. 2000
10.89
+0.43
4.11%
1 janv. 2001
4.62
-6.27
-57.58%
1 janv. 2002
4.62
0.0
0.0%
1 janv. 2003
4.84
+0.22
4.76%
1 janv. 2004
4.84
0.0
0.0%
1 janv. 2005
4.84
0.0
0.0%
1 janv. 2006
4.84
0.0
0.0%
1 janv. 2007
4.84
0.0
0.0%
1 janv. 2008
5.05
+0.21
4.34%
1 janv. 2009
5.05
0.0
0.0%
1 janv. 2010
5.05
0.0
0.0%
1 janv. 2011
5.05
0.0
0.0%
1 janv. 2012
5.05
0.0
0.0%
1 janv. 2013
5.82
+0.77
15.25%
1 janv. 2014
5.82
0.0
0.0%
1 janv. 2015
5.82
0.0
0.0%
1 janv. 2016
5.82
0.0
0.0%

Classement des pays selon les statistiques actuelles par années