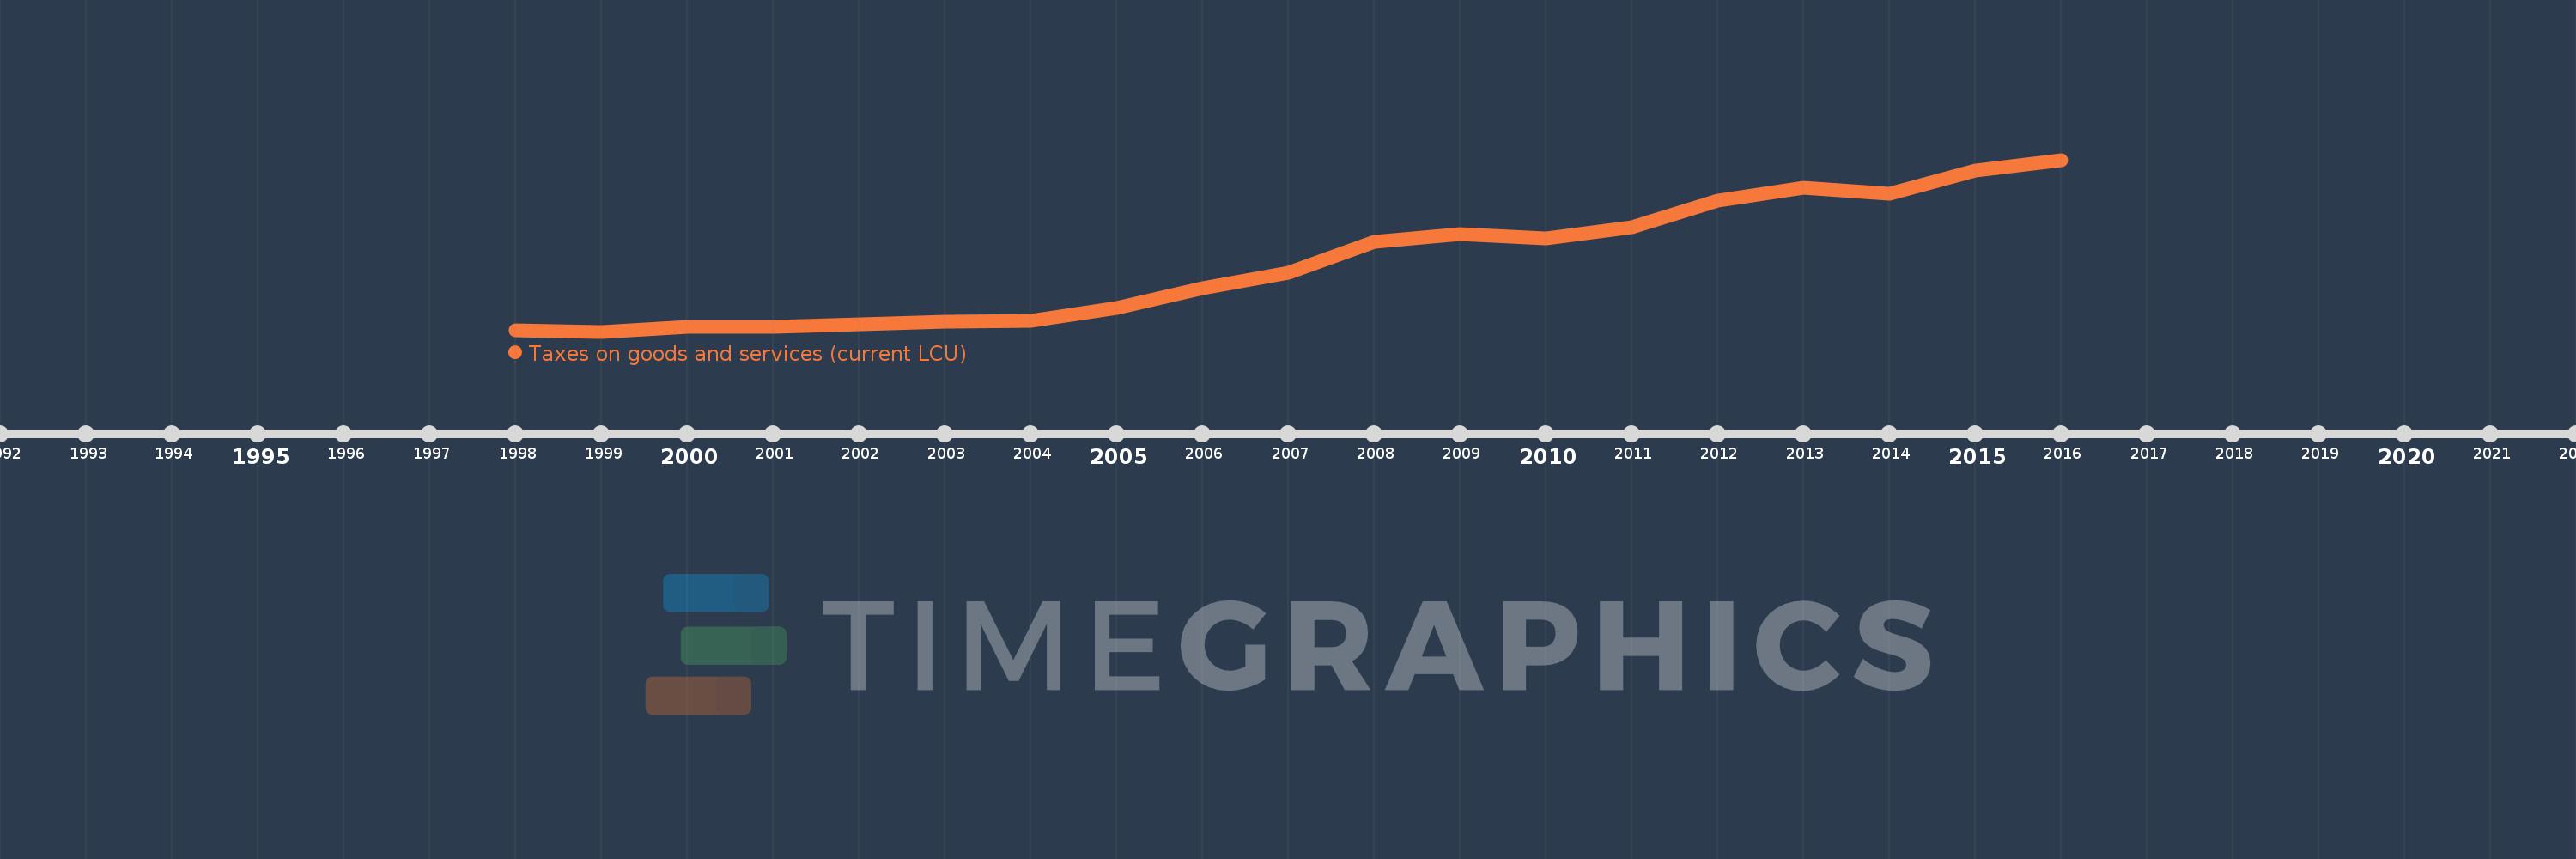
Cette échelle de temps montre un graphique de 1998 année à 2016 année Georgia. Les données jusqu'à 1997 année ne sont pas présentés. Quantité d'observations actuelles selon dates: 19.
Source (désignation):
Les indicateurs du développement mondiale
Source (organisation):
International Monetary Fund, Government Finance Statistics Yearbook and data files.
Catégories:
Public Sector
Dernière mise à jour
23 avr. 2017
Les indicateurs de changement de valeurs selon les années
En moyenne:
1.886 mds
Minimum:
245.9 mln.
1 janv. 1999
Maximum:
4.376 mds
1 janv. 2016
Pour la date d''observation
Valeur
Changement absolu
Le changement par rapport à la valeur précédente
1 janv. 1998
278.6 mln.
+278.6 mln.
0.0%
1 janv. 1999
245.9 mln.
-32.7 mln.
-11.74%
1 janv. 2000
356.9 mln.
+111.0 mln.
45.14%
1 janv. 2001
366.1 mln.
+9.2 mln.
2.58%
1 janv. 2002
426.7 mln.
+60.6 mln.
16.55%
1 janv. 2003
489.2 mln.
+62.5 mln.
14.65%
1 janv. 2004
504.2 mln.
+15.0 mln.
3.07%
1 janv. 2005
811.8 mln.
+307.6 mln.
61.01%
1 janv. 2006
1.282 mds
+470.7 mln.
57.98%
1 janv. 2007
1.668 mds
+385.8 mln.
30.08%
1 janv. 2008
2.402 mds
+734.0 mln.
44.0%
1 janv. 2009
2.587 mds
+185.2 mln.
7.71%
1 janv. 2010
2.495 mds
-92.6 mln.
-3.58%
1 janv. 2011
2.764 mds
+269.0 mln.
10.78%
1 janv. 2012
3.4 mds
+635.6 mln.
23.0%
1 janv. 2013
3.7 mds
+300.4 mln.
8.84%
1 janv. 2014
3.57 mds
-129.8 mln.
-3.51%
1 janv. 2015
4.109 mds
+538.6 mln.
15.09%
1 janv. 2016
4.376 mds
+267.5 mln.
6.51%
Classement des pays selon les statistiques actuelles par années