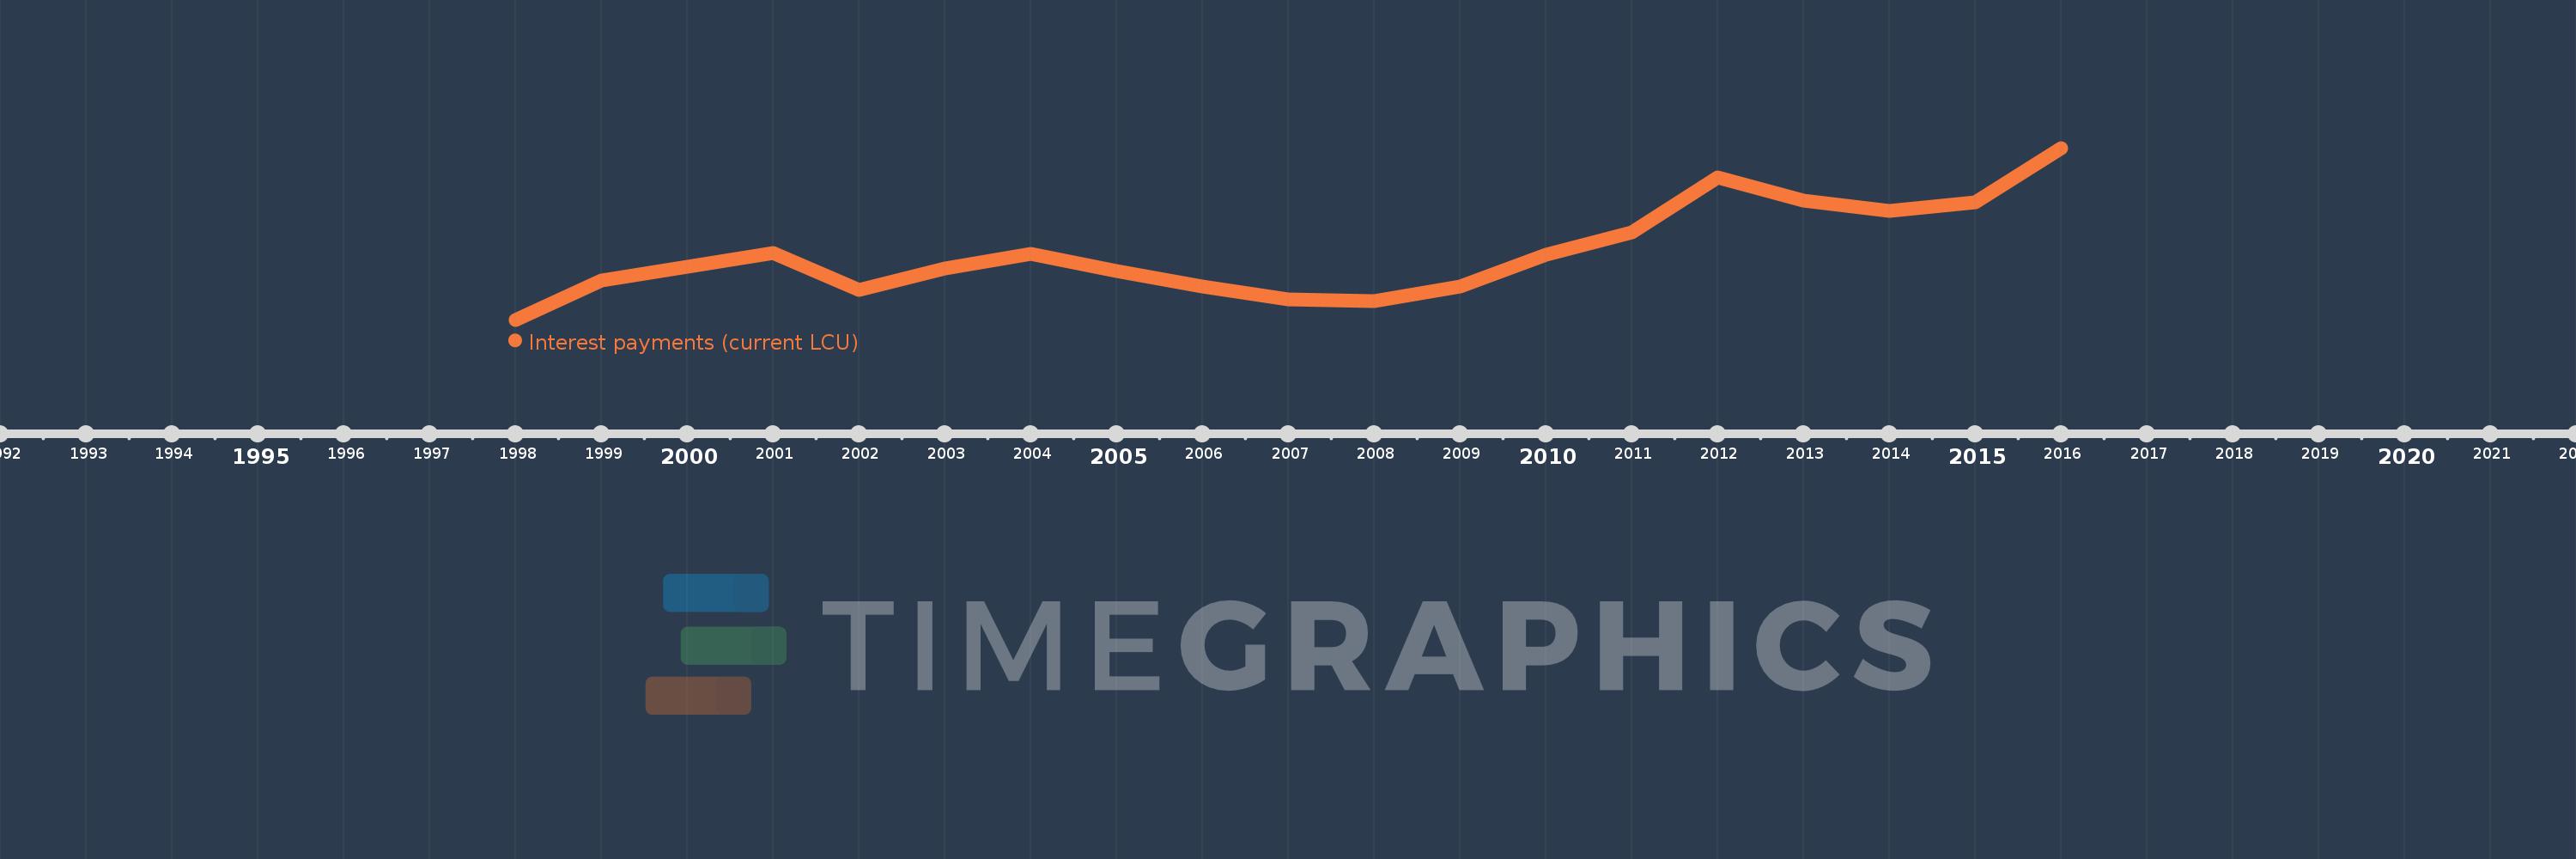
Cette échelle de temps montre un graphique de 1998 année à 2016 année Georgia. Les données jusqu'à 1997 année ne sont pas présentés. Quantité d'observations actuelles selon dates: 19.
Source (désignation):
Les indicateurs du développement mondiale
Source (organisation):
International Monetary Fund, Government Finance Statistics Yearbook and data files.
Catégories:
Public Sector
Dernière mise à jour
23 avr. 2017
Les indicateurs de changement de valeurs selon les années
En moyenne:
169.995 mln.
Minimum:
70.1 mln.
1 janv. 1998
Maximum:
326.6 mln.
1 janv. 2016
Pour la date d''observation
Valeur
Changement absolu
Le changement par rapport à la valeur précédente
1 janv. 1998
70.1 mln.
+70.1 mln.
0.0%
1 janv. 1999
128.1 mln.
+58.0 mln.
82.74%
1 janv. 2000
148.6 mln.
+20.5 mln.
16.0%
1 janv. 2001
169.8 mln.
+21.2 mln.
14.27%
1 janv. 2002
115.0 mln.
-54.8 mln.
-32.27%
1 janv. 2003
146.7 mln.
+31.7 mln.
27.57%
1 janv. 2004
168.5 mln.
+21.8 mln.
14.86%
1 janv. 2005
142.4 mln.
-26.1 mln.
-15.49%
1 janv. 2006
120.1 mln.
-22.3 mln.
-15.66%
1 janv. 2007
100.5 mln.
-19.6 mln.
-16.32%
1 janv. 2008
97.4 mln.
-3.1 mln.
-3.08%
1 janv. 2009
119.3 mln.
+21.9 mln.
22.48%
1 janv. 2010
167.2 mln.
+47.9 mln.
40.15%
1 janv. 2011
200.7 mln.
+33.5 mln.
20.04%
1 janv. 2012
282.7 mln.
+82.0 mln.
40.86%
1 janv. 2013
248.3 mln.
-34.4 mln.
-12.17%
1 janv. 2014
233.0 mln.
-15.3 mln.
-6.16%
1 janv. 2015
244.9 mln.
+11.9 mln.
5.11%
1 janv. 2016
326.6 mln.
+81.7 mln.
33.36%
Classement des pays selon les statistiques actuelles par années