33
/fr/
AIzaSyAYiBZKx7MnpbEhh9jyipgxe19OcubqV5w
August 1, 2025
130368
Ethiopia
ETH
true
2
1
Employment to population ratio, ages 15-24, male (%) (national estimate)
2014,2013,2012,2011,2010
Download
Bibliothèque de statistiques globales →Ethiopia →

Employment to population ratio, ages 15-24, male (%) (national estimate)

Cette statistique dans les autres pays:

AlbaniaAlgeriaArgentinaArmeniaArubaAustraliaAustriaAzerbaijanBangladeshBarbadosBelarusBelgiumBelizeBeninBhutanBoliviaBosnia and HerzegovinaBotswanaBrazilBulgariaCanadaCayman IslandsCentral Europe and the BalticsChileColombiaCosta RicaCroatiaCyprusCzech RepublicDenmarkDominican RepublicEcuadorEgypt, Arab Rep.El SalvadorEstoniaEthiopiaEuro areaEurope & Central AsiaEurope & Central Asia (excluding high income)Europe & Central Asia (IDA & IBRD countries)European UnionFinlandFranceFrench PolynesiaGabonGambia, TheGermanyGreeceGuamGuatemalaGuineaHigh incomeHondurasHong Kong SAR, ChinaHungaryIcelandIndiaIndonesiaIran, Islamic Rep.IrelandIsle of ManIsraelItalyJapanJordanKiribatiKorea, Rep.KosovoKyrgyz RepublicLatin America & Caribbean Latin America & Caribbean (excluding high income)Latin America & the Caribbean (IDA & IBRD countries)LatviaLesothoLibyaLithuaniaLuxembourgMacao SAR, ChinaMacedonia, FYRMadagascarMalawiMalaysiaMaldivesMaliMaltaMauritiusMexicoMoldovaMongoliaMontenegroMoroccoMozambiqueNamibiaNetherlandsNew ZealandNorth AmericaNorwayOECD membersOmanPanamaParaguayPeruPolandPortugalPost-demographic dividendPuerto RicoQatarRomaniaRussian FederationSamoaSaudi ArabiaSenegalSerbiaSeychellesSlovak RepublicSloveniaSouth AfricaSouth AsiaSouth Asia (IDA & IBRD)South SudanSpainSri LankaSt. LuciaSt. Vincent and the GrenadinesSudanSurinameSwedenSwitzerlandSyrian Arab RepublicTanzaniaThailandTimor-LesteTrinidad and TobagoTunisiaTurkeyUkraineUnited KingdomUnited StatesUruguayVenezuela, RBVietnamWest Bank and GazaYemen, Rep.ZambiaZimbabwe

La ligne de temps

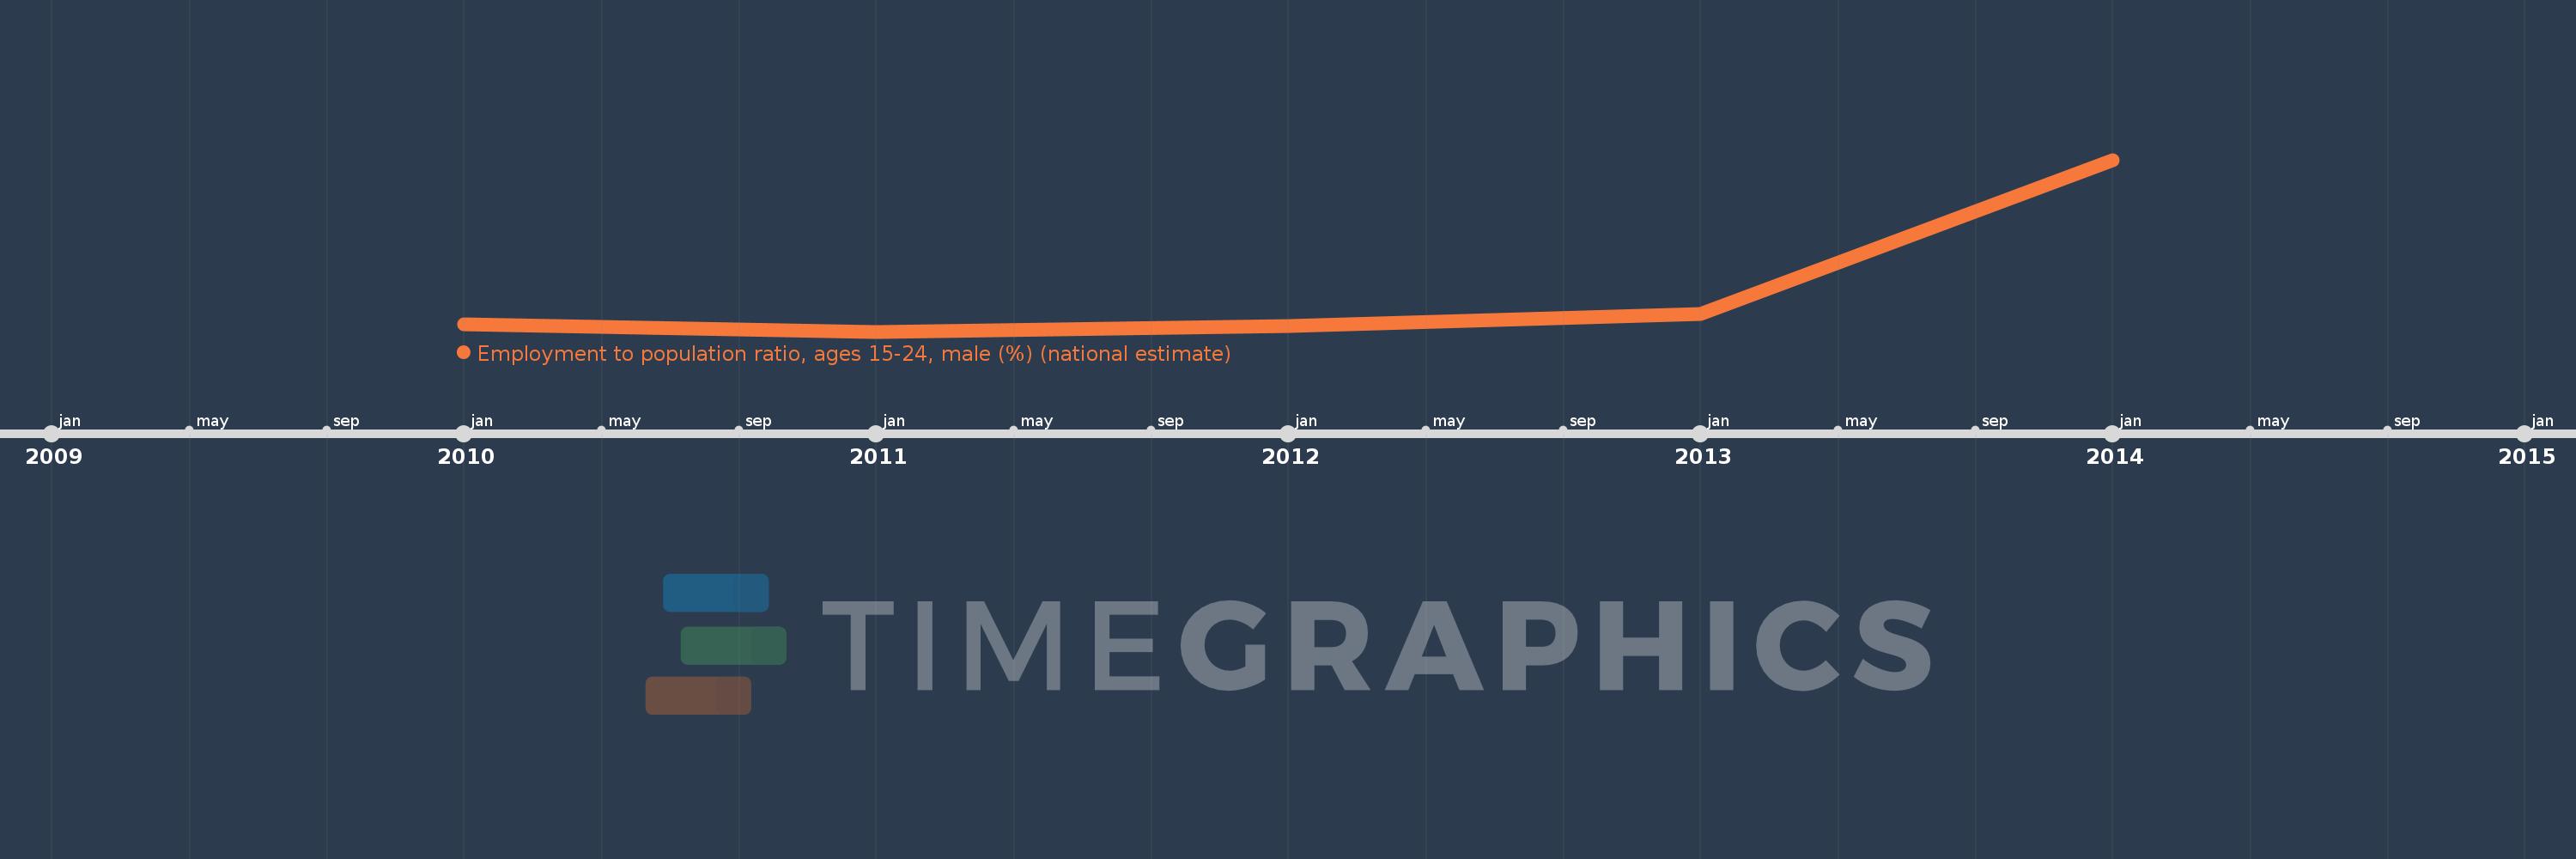
Cette échelle de temps montre un graphique de 2010 année à 2014 année Ethiopia. Les données jusqu'à 2009 année ne sont pas présentés. Quantité d'observations actuelles selon dates: 5.

Source (désignation):

Les indicateurs du développement mondiale

Source (organisation):

International Labour Organization, Key Indicators of the Labour Market database.

Catégories:

Social Protection & Labor

Dernière mise à jour

23 avr. 2017

Les indicateurs de changement de valeurs selon les années

En moyenne:
49.12
Minimum:
40.5
1 janv. 2011
Maximum:
77.0
1 janv. 2014
Pour la date d''observation
Valeur
Changement absolu
Le changement par rapport à la valeur précédente
1 janv. 2010
42.1
+42.1
0.0%
1 janv. 2011
40.5
-1.6
-3.8%
1 janv. 2012
41.7
+1.2
2.96%
1 janv. 2013
44.3
+2.6
6.24%
1 janv. 2014
77.0
+32.7
73.81%

Classement des pays selon les statistiques actuelles par années