30
/fr/
AIzaSyAYiBZKx7MnpbEhh9jyipgxe19OcubqV5w
April 1, 2024
129486
Estonia
EST
true
2
1
Industry, value added (annual % growth)
2016,2015,2014,2013,2012,2011,2010,2009,2008,2007,2006,2005,2004,2003,2002,2001,2000,1999,1998,1997
Download
Bibliothèque de statistiques globales →Estonia →

Industry, value added (annual % growth)

Cette statistique dans les autres pays:

AfghanistanAlbaniaAlgeriaAntigua and BarbudaArab WorldArgentinaArmeniaAustraliaAustriaAzerbaijanBahamas, TheBahrainBangladeshBelarusBelgiumBelizeBeninBermudaBhutanBoliviaBosnia and HerzegovinaBotswanaBrazilBrunei DarussalamBulgariaBurkina FasoBurundiCabo VerdeCambodiaCameroonCanadaCaribbean small statesCayman IslandsCentral African RepublicCentral Europe and the BalticsChadChileChinaColombiaComorosCongo, Dem. Rep.Congo, Rep.Costa RicaCote d'IvoireCroatiaCubaCyprusCzech RepublicDenmarkDjiboutiDominicaDominican RepublicEarly-demographic dividendEast Asia & PacificEast Asia & Pacific (excluding high income)East Asia & Pacific (IDA & IBRD countries)EcuadorEgypt, Arab Rep.El SalvadorEquatorial GuineaEritreaEstoniaEthiopiaEuro areaEurope & Central AsiaEurope & Central Asia (excluding high income)Europe & Central Asia (IDA & IBRD countries)European UnionFijiFinlandFragile and conflict affected situationsFranceGabonGambia, TheGeorgiaGermanyGhanaGreeceGrenadaGuatemalaGuineaGuinea-BissauGuyanaHaitiHeavily indebted poor countries (HIPC)High incomeHondurasHong Kong SAR, ChinaHungaryIBRD onlyIcelandIDA & IBRD totalIDA blendIDA onlyIDA totalIndiaIndonesiaIran, Islamic Rep.IraqIrelandItalyJamaicaJapanJordanKazakhstanKenyaKiribatiKorea, Rep.KosovoKuwaitKyrgyz RepublicLao PDRLate-demographic dividendLatin America & Caribbean Latin America & Caribbean (excluding high income)Latin America & the Caribbean (IDA & IBRD countries)LatviaLeast developed countries: UN classificationLebanonLesothoLiberiaLithuaniaLow & middle incomeLow incomeLower middle incomeLuxembourgMacedonia, FYRMadagascarMalawiMalaysiaMaldivesMaliMarshall IslandsMauritaniaMauritiusMexicoMicronesia, Fed. Sts.Middle East & North AfricaMiddle East & North Africa (excluding high income)Middle East & North Africa (IDA & IBRD countries)Middle incomeMoldovaMongoliaMontenegroMoroccoMozambiqueMyanmarNamibiaNepalNetherlandsNew ZealandNicaraguaNigerNigeriaNorth AmericaNorwayOECD membersOmanOther small statesPacific island small statesPakistanPalauPanamaPapua New GuineaParaguayPeruPhilippinesPolandPortugalPost-demographic dividendPre-demographic dividendPuerto RicoQatarRomaniaRussian FederationRwandaSamoaSao Tome and PrincipeSaudi ArabiaSenegalSerbiaSeychellesSierra LeoneSingaporeSlovak RepublicSloveniaSmall statesSolomon IslandsSomaliaSouth AfricaSouth AsiaSouth Asia (IDA & IBRD)SpainSri LankaSt. Kitts and NevisSt. LuciaSt. Vincent and the GrenadinesSub-Saharan Africa Sub-Saharan Africa (excluding high income)Sub-Saharan Africa (IDA & IBRD countries)SudanSurinameSwazilandSwedenSwitzerlandSyrian Arab RepublicTajikistanTanzaniaThailandTimor-LesteTogoTongaTrinidad and TobagoTunisiaTurkeyTurkmenistanTuvaluUgandaUkraineUnited Arab EmiratesUnited KingdomUnited StatesUpper middle incomeUruguayUzbekistanVanuatuVenezuela, RBVietnamWest Bank and GazaWorldZambiaZimbabwe

La ligne de temps

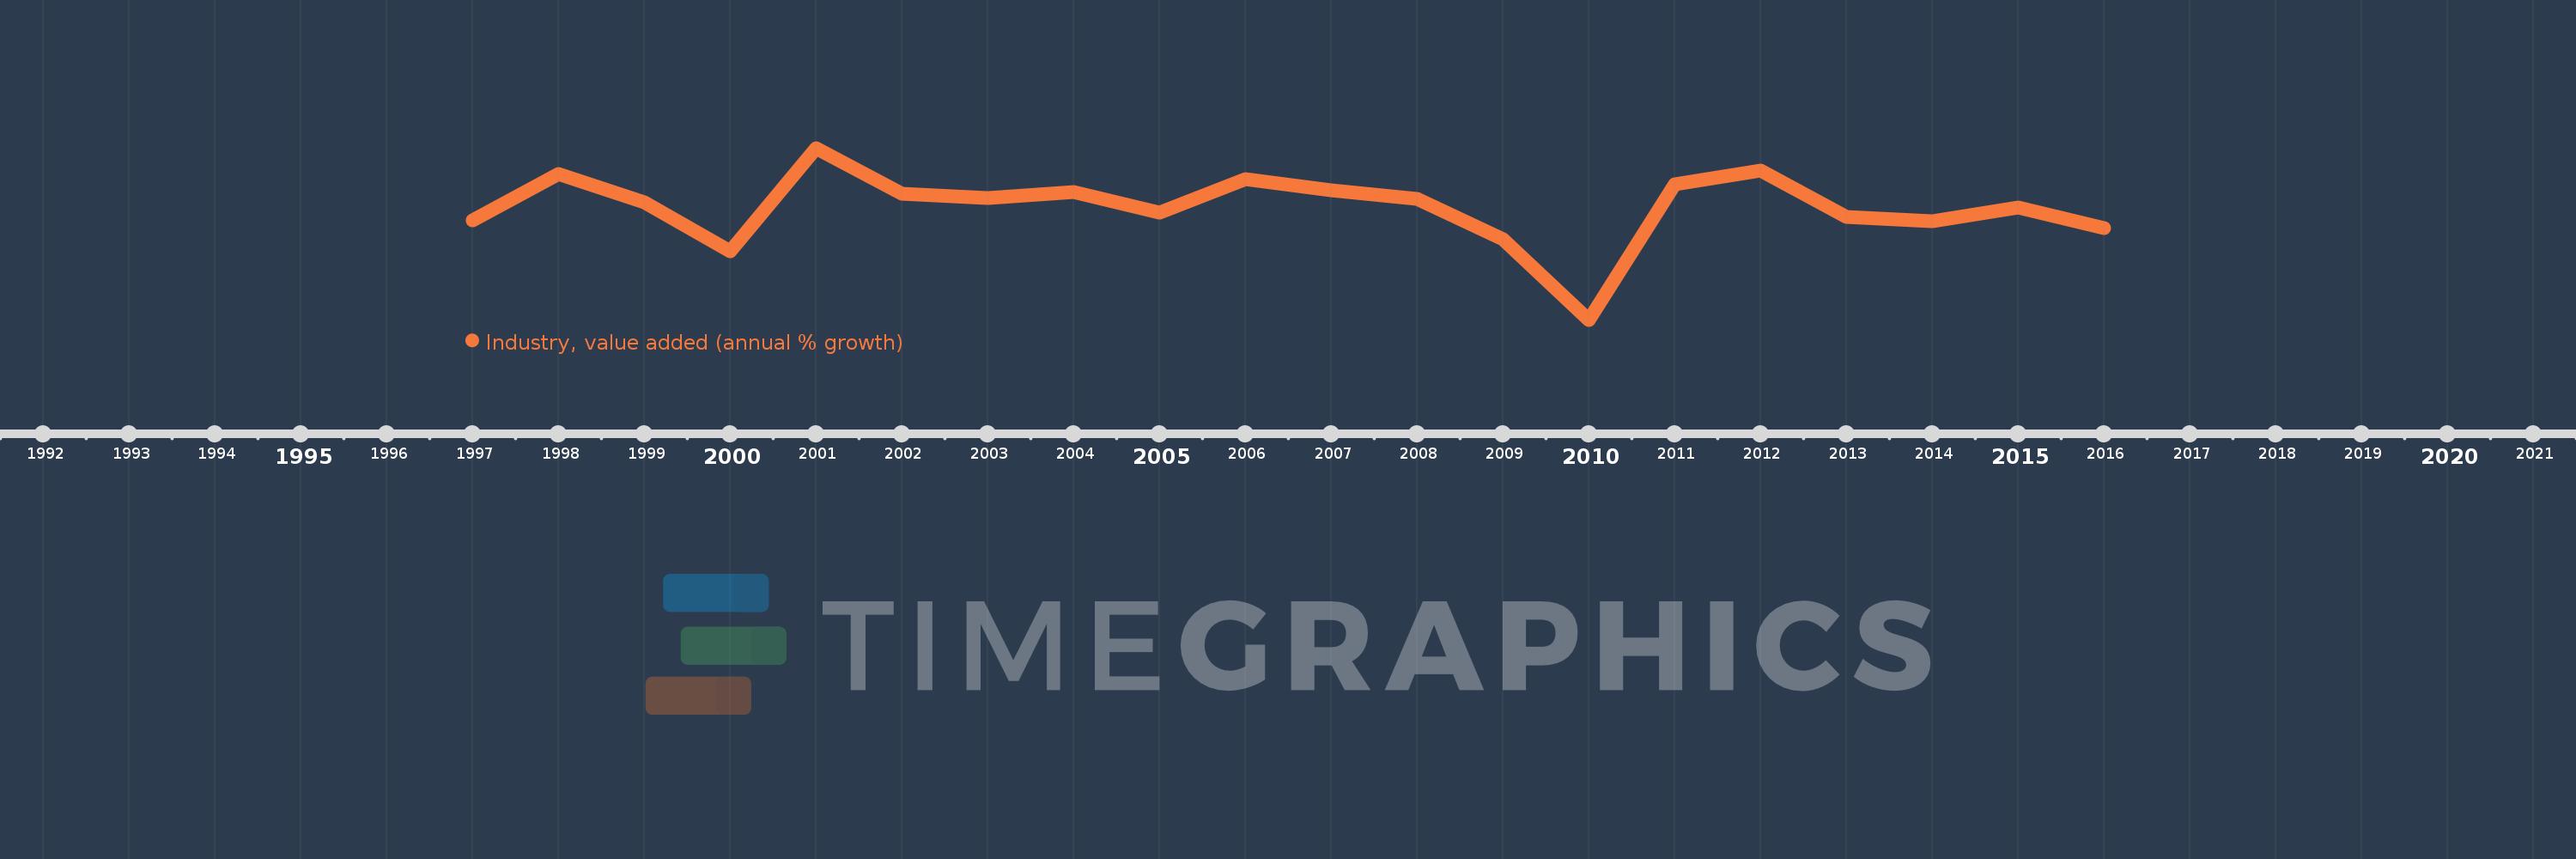
Cette échelle de temps montre un graphique de 1997 année à 2016 année Estonia. Les données jusqu'à 1996 année ne sont pas présentés. Quantité d'observations actuelles selon dates: 20.

Source (désignation):

Les indicateurs du développement mondiale

Source (organisation):

World Bank national accounts data, and OECD National Accounts data files.

Catégories:

Economy & Growth

Dernière mise à jour

23 avr. 2017

Les indicateurs de changement de valeurs selon les années

En moyenne:
5.069
Minimum:
-23.326
1 janv. 2010
Maximum:
20.123
1 janv. 2001
Pour la date d''observation
Valeur
Changement absolu
Le changement par rapport à la valeur précédente
1 janv. 1997
1.862
+1.862
0.0%
1 janv. 1998
13.517
+11.656
626.01%
1 janv. 1999
6.408
-7.11
-52.6%
1 janv. 2000
-5.953
-12.361
-192.9%
1 janv. 2001
20.123
+26.076
-438.05%
1 janv. 2002
8.513
-11.61
-57.7%
1 janv. 2003
7.499
-1.014
-11.91%
1 janv. 2004
8.922
+1.423
18.97%
1 janv. 2005
3.748
-5.174
-57.99%
1 janv. 2006
12.142
+8.395
224.01%
1 janv. 2007
9.342
-2.8
-23.06%
1 janv. 2008
7.239
-2.103
-22.51%
1 janv. 2009
-3.038
-10.278
-141.97%
1 janv. 2010
-23.326
-20.288
667.8%
1 janv. 2011
11.005
+34.331
-147.18%
1 janv. 2012
14.408
+3.403
30.93%
1 janv. 2013
2.616
-11.793
-81.85%
1 janv. 2014
1.486
-1.13
-43.19%
1 janv. 2015
5.022
+3.536
237.95%
1 janv. 2016
-0.147
-5.17
-102.93%

Classement des pays selon les statistiques actuelles par années