29
/fr/
fr
AIzaSyAYiBZKx7MnpbEhh9jyipgxe19OcubqV5w
April 1, 2024
125054
Egypt, Arab Rep.
EGY
true
2
1
Lower secondary completion rate, female (% of relevant age group)
2015,2014,2010,2005,2004,1995,1981,1980,1979,1978
Download
Bibliothèque de statistiques globales →Egypt, Arab Rep. →

Lower secondary completion rate, female (% of relevant age group)

Cette statistique dans les autres pays:
AfghanistanAlbaniaAlgeriaAngolaAntigua and BarbudaArab WorldArgentinaArmeniaArubaAustriaAzerbaijanBahamas, TheBahrainBangladeshBarbadosBelarusBelgiumBelizeBeninBermudaBhutanBoliviaBosnia and HerzegovinaBotswanaBrunei DarussalamBulgariaBurkina FasoBurundiCabo VerdeCambodiaCameroonCaribbean small statesCentral African RepublicCentral Europe and the BalticsChadChileChinaColombiaComorosCongo, Dem. Rep.Congo, Rep.Costa RicaCote d'IvoireCroatiaCubaCyprusCzech RepublicDenmarkDjiboutiDominicaDominican RepublicEarly-demographic dividendEast Asia & PacificEast Asia & Pacific (excluding high income)East Asia & Pacific (IDA & IBRD countries)EcuadorEgypt, Arab Rep.El SalvadorEquatorial GuineaEritreaEstoniaEthiopiaEuro areaEurope & Central AsiaEurope & Central Asia (excluding high income)Europe & Central Asia (IDA & IBRD countries)European UnionFijiFinlandFragile and conflict affected situationsFranceGabonGambia, TheGeorgiaGermanyGhanaGreeceGrenadaGuatemalaGuineaGuinea-BissauGuyanaHaitiHeavily indebted poor countries (HIPC)High incomeHondurasHong Kong SAR, ChinaHungaryIBRD onlyIcelandIDA & IBRD totalIDA blendIDA onlyIDA totalIndiaIndonesiaIran, Islamic Rep.IraqIrelandIsraelItalyJamaicaJapanJordanKazakhstanKenyaKiribatiKorea, Dem. People’s Rep.Korea, Rep.KuwaitKyrgyz RepublicLao PDRLate-demographic dividendLatin America & Caribbean Latin America & Caribbean (excluding high income)Latin America & the Caribbean (IDA & IBRD countries)LatviaLeast developed countries: UN classificationLebanonLesothoLiberiaLiechtensteinLithuaniaLow & middle incomeLow incomeLower middle incomeLuxembourgMacao SAR, ChinaMacedonia, FYRMadagascarMalawiMaldivesMaliMaltaMarshall IslandsMauritaniaMauritiusMexicoMiddle East & North AfricaMiddle East & North Africa (excluding high income)Middle East & North Africa (IDA & IBRD countries)Middle incomeMoldovaMongoliaMontenegroMoroccoMozambiqueMyanmarNamibiaNauruNepalNetherlandsNicaraguaNigerNorwayOECD membersOmanOther small statesPacific island small statesPakistanPalauPanamaPapua New GuineaParaguayPeruPhilippinesPolandPortugalPost-demographic dividendPre-demographic dividendQatarRomaniaRussian FederationRwandaSamoaSan MarinoSao Tome and PrincipeSaudi ArabiaSenegalSerbiaSeychellesSierra LeoneSlovak RepublicSloveniaSmall statesSolomon IslandsSouth AfricaSouth AsiaSouth Asia (IDA & IBRD)South SudanSpainSri LankaSt. Kitts and NevisSt. LuciaSt. Vincent and the GrenadinesSub-Saharan Africa Sub-Saharan Africa (excluding high income)Sub-Saharan Africa (IDA & IBRD countries)SudanSurinameSwazilandSwedenSwitzerlandSyrian Arab RepublicTajikistanTanzaniaThailandTimor-LesteTogoTongaTrinidad and TobagoTunisiaTurkeyTuvaluUgandaUkraineUnited Arab EmiratesUpper middle incomeUruguayUzbekistanVanuatuVenezuela, RBVietnamWest Bank and GazaWorldYemen, Rep.ZambiaZimbabwe
La ligne de temps
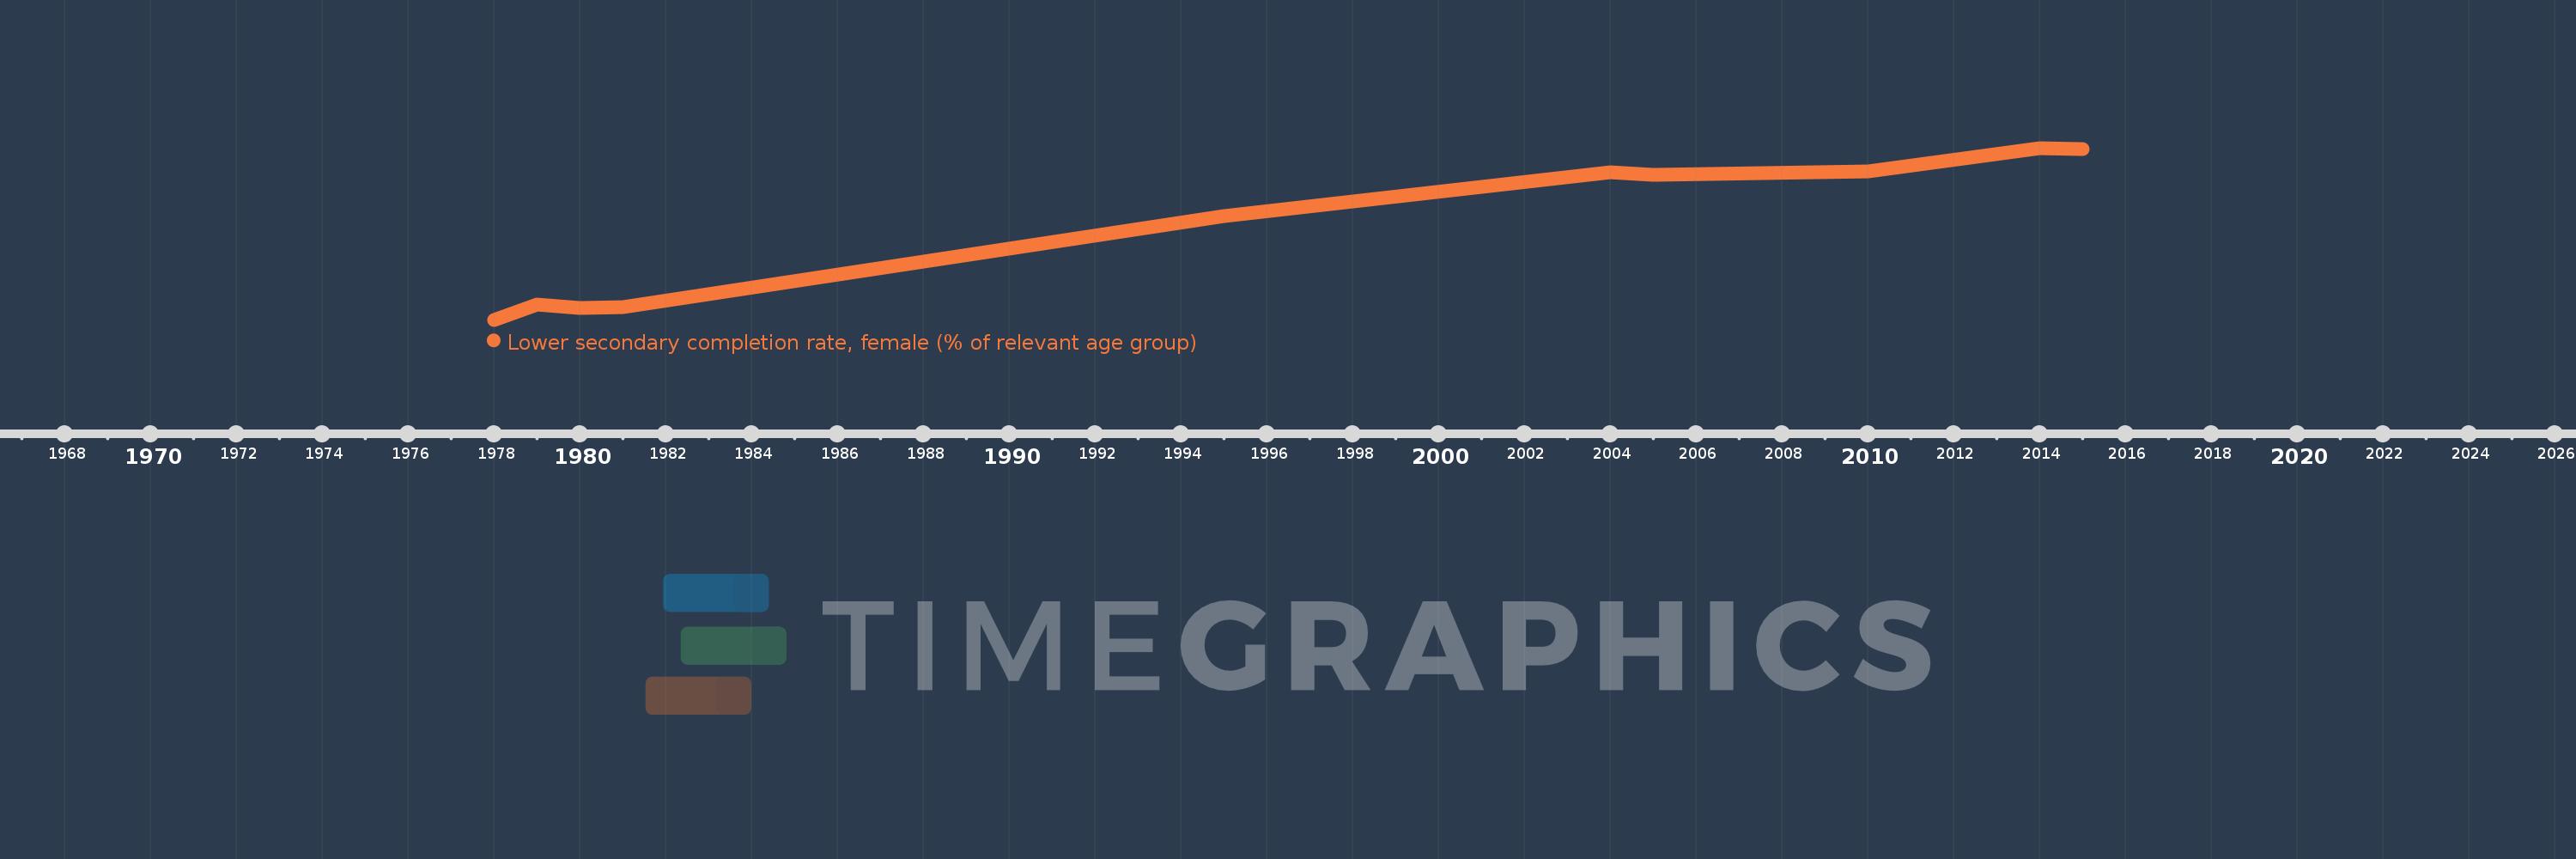
Cette échelle de temps montre un graphique de 1978 année à 2015 année Egypt, Arab Rep.. Les données jusqu'à 1977 année ne sont pas présentés. Quantité d'observations actuelles selon dates: 10.
Source (désignation):
Les indicateurs du développement mondiale
Source (organisation):
United Nations Educational, Scientific, and Cultural Organization (UNESCO) Institute for Statistics.
Catégories:
Education
Dernière mise à jour
23 avr. 2017
Les indicateurs de changement de valeurs selon les années
En moyenne:
60.063
Minimum:
30.072
1 janv. 1978
Maximum:
85.624
1 janv. 2014
Pour la date d''observation
Valeur
Changement absolu
Le changement par rapport à la valeur précédente
1 janv. 1978
30.072
+30.072
0.0%
1 janv. 1979
35.04
+4.968
16.52%
1 janv. 1980
33.939
-1.102
-3.14%
1 janv. 1981
34.187
+0.248
0.73%
1 janv. 1995
63.517
+29.33
85.79%
1 janv. 2004
77.753
+14.236
22.41%
1 janv. 2005
77.061
-0.692
-0.89%
1 janv. 2010
78.154
+1.093
1.42%
1 janv. 2014
85.624
+7.47
9.56%
1 janv. 2015
85.287
-0.336
-0.39%
Classement des pays selon les statistiques actuelles par années

Commentaires:

Envoyer
PremiumAbout & FeedbackUn accordConfidentialité
logo
© 2022 Selected Technologies LLC – Morgan Hill, California