29
/fr/
fr
AIzaSyAYiBZKx7MnpbEhh9jyipgxe19OcubqV5w
April 1, 2024
120223
Djibouti
DJI
true
2
1
Net trade in goods (BoP, current US$)
2016,2015,2014,2013,2012,2011,2010,2009,2008,2007,2006,2005,2004,2003,2002,2001,2000,1999,1998,1997,1996,1995,1994,1993,1992
Download
Bibliothèque de statistiques globales →Djibouti →

Net trade in goods (BoP, current US$)

Cette statistique dans les autres pays:
AfghanistanAlbaniaAlgeriaAngolaAntigua and BarbudaArgentinaArmeniaArubaAustraliaAustriaAzerbaijanBahamas, TheBahrainBangladeshBarbadosBelarusBelgiumBelizeBeninBermudaBhutanBoliviaBosnia and HerzegovinaBotswanaBrazilBrunei DarussalamBulgariaBurkina FasoBurundiCabo VerdeCambodiaCameroonCanadaCentral African RepublicChadChileChinaColombiaComorosCongo, Dem. Rep.Congo, Rep.Costa RicaCote d'IvoireCroatiaCuracaoCyprusCzech RepublicDenmarkDjiboutiDominicaDominican RepublicEcuadorEgypt, Arab Rep.El SalvadorEquatorial GuineaEritreaEstoniaEthiopiaEuro areaFaroe IslandsFijiFinlandFranceFrench PolynesiaGabonGambia, TheGeorgiaGermanyGhanaGreeceGrenadaGuatemalaGuineaGuinea-BissauGuyanaHaitiHondurasHong Kong SAR, ChinaHungaryIcelandIndiaIndonesiaIran, Islamic Rep.IraqIrelandIsraelItalyJamaicaJapanJordanKazakhstanKenyaKiribatiKorea, Rep.KosovoKuwaitKyrgyz RepublicLao PDRLatviaLebanonLesothoLiberiaLibyaLithuaniaLuxembourgMacao SAR, ChinaMacedonia, FYRMadagascarMalawiMalaysiaMaldivesMaliMaltaMarshall IslandsMauritaniaMauritiusMexicoMicronesia, Fed. Sts.MoldovaMongoliaMontenegroMoroccoMozambiqueMyanmarNamibiaNepalNetherlandsNew CaledoniaNew ZealandNicaraguaNigerNigeriaNorwayOmanPakistanPalauPanamaPapua New GuineaParaguayPeruPhilippinesPolandPortugalQatarRomaniaRussian FederationRwandaSamoaSao Tome and PrincipeSaudi ArabiaSenegalSerbiaSeychellesSierra LeoneSingaporeSint Maarten (Dutch part)Slovak RepublicSloveniaSolomon IslandsSouth AfricaSouth SudanSpainSri LankaSt. Kitts and NevisSt. LuciaSt. Vincent and the GrenadinesSudanSurinameSwazilandSwedenSwitzerlandSyrian Arab RepublicTajikistanTanzaniaThailandTimor-LesteTogoTongaTrinidad and TobagoTunisiaTurkeyTuvaluUgandaUkraineUnited KingdomUnited StatesUruguayVanuatuVenezuela, RBVietnamWest Bank and GazaYemen, Rep.ZambiaZimbabwe
La ligne de temps
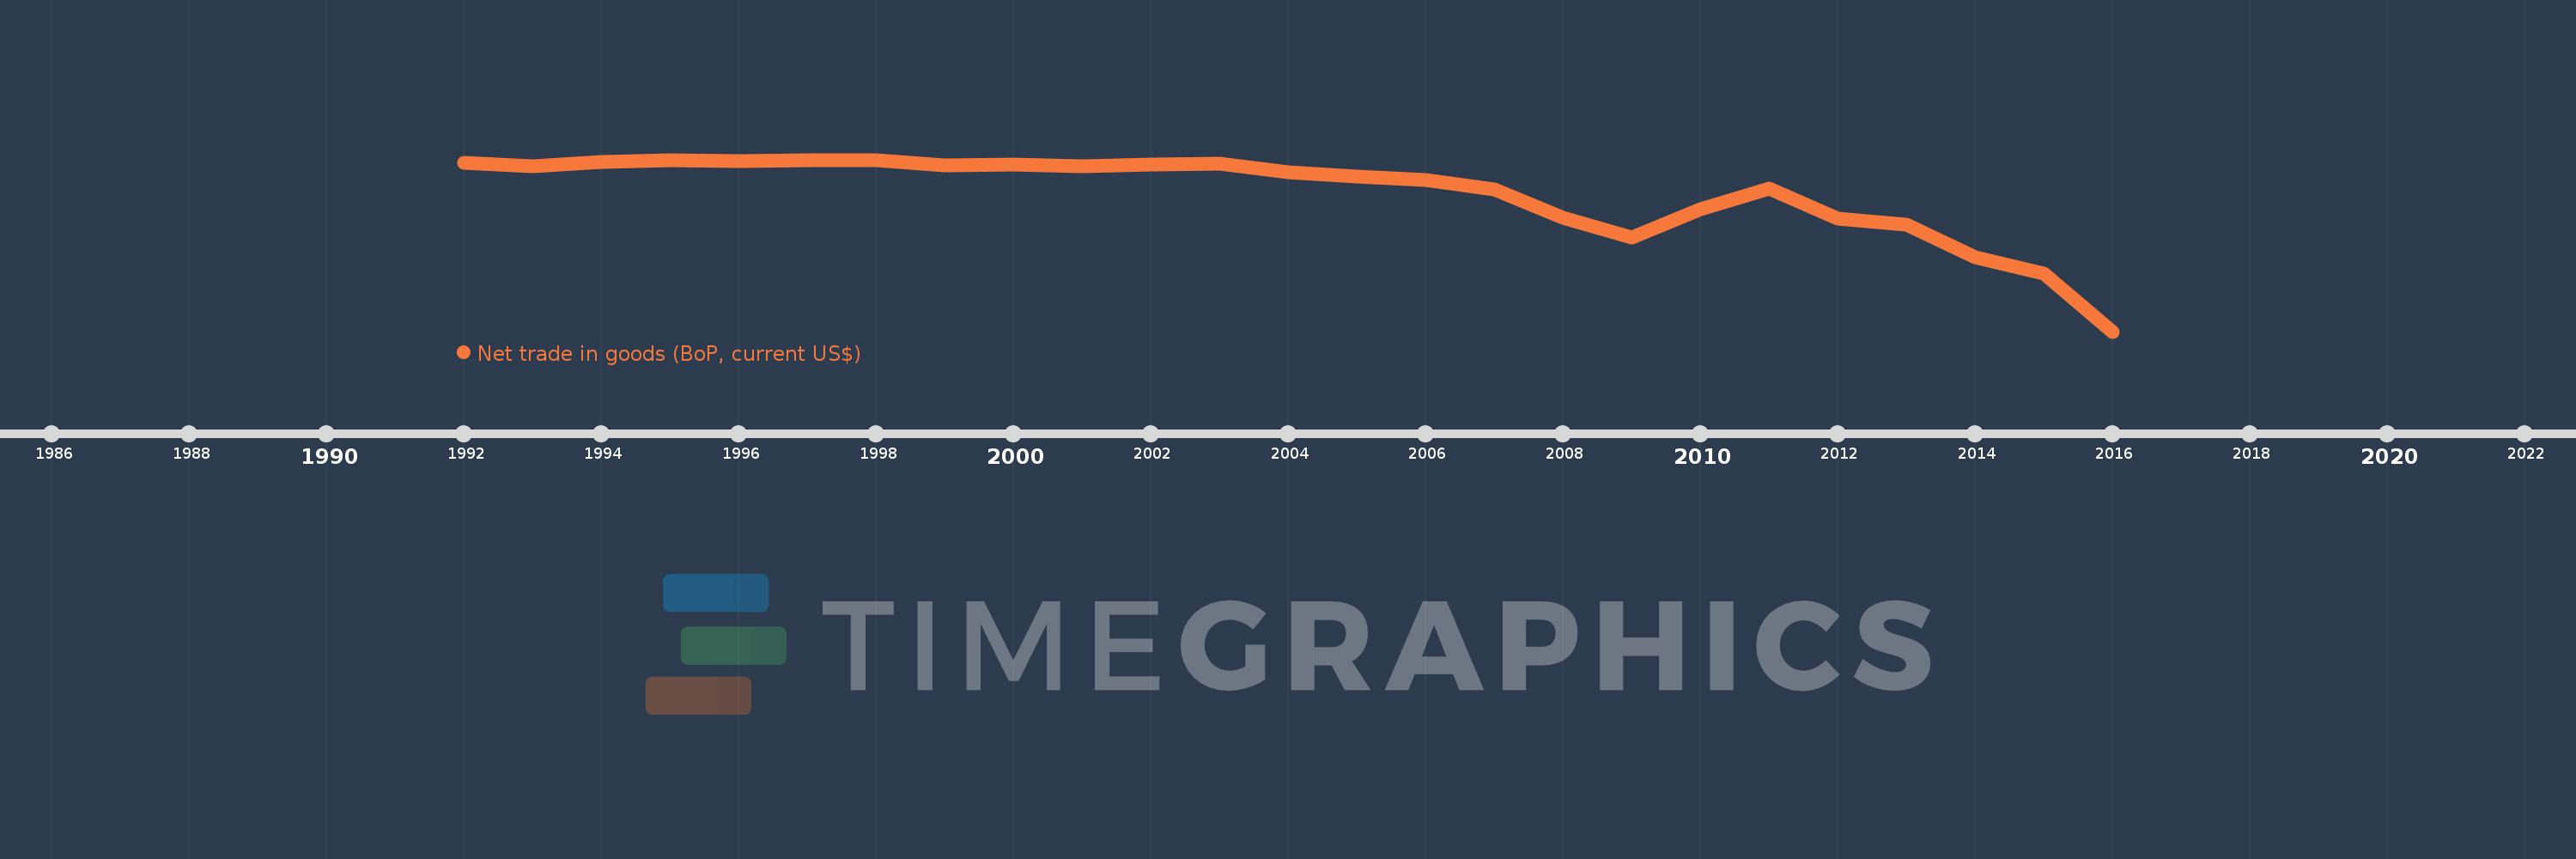
Cette échelle de temps montre un graphique de 1992 année à 2016 année Djibouti. Les données jusqu'à 1991 année ne sont pas présentés. Quantité d'observations actuelles selon dates: 25.
Source (désignation):
Les indicateurs du développement mondiale
Source (organisation):
International Monetary Fund, Balance of Payments Statistics Yearbook and data files.
Catégories:
Economy & Growth, Trade
Dernière mise à jour
23 avr. 2017
Les indicateurs de changement de valeurs selon les années
En moyenne:
-300.026 mln.
Minimum:
-946.77 mln.
1 janv. 2016
Maximum:
-143.151 mln.
1 janv. 1997
Pour la date d''observation
Valeur
Changement absolu
Le changement par rapport à la valeur précédente
1 janv. 1992
-158.394 mln.
-158.394 mln.
0.0%
1 janv. 1993
-172.816 mln.
-14.421 mln.
9.1%
1 janv. 1994
-153.128 mln.
+19.688 mln.
-11.39%
1 janv. 1995
-145.796 mln.
+7.332 mln.
-4.79%
1 janv. 1996
-147.962 mln.
-2.166 mln.
1.49%
1 janv. 1997
-143.151 mln.
+4.811 mln.
-3.25%
1 janv. 1998
-144.828 mln.
-1.677 mln.
1.17%
1 janv. 1999
-167.532 mln.
-22.704 mln.
15.68%
1 janv. 2000
-166.249 mln.
+1.283 mln.
-0.77%
1 janv. 2001
-174.909 mln.
-8.66 mln.
5.21%
1 janv. 2002
-164.032 mln.
+10.877 mln.
-6.22%
1 janv. 2003
-161.438 mln.
+2.594 mln.
-1.58%
1 janv. 2004
-200.984 mln.
-39.545 mln.
24.5%
1 janv. 2005
-223.378 mln.
-22.395 mln.
11.14%
1 janv. 2006
-237.817 mln.
-14.438 mln.
6.46%
1 janv. 2007
-280.546 mln.
-42.73 mln.
17.97%
1 janv. 2008
-415.162 mln.
-134.615 mln.
47.98%
1 janv. 2009
-505.32 mln.
-90.158 mln.
21.72%
1 janv. 2010
-373.344 mln.
+131.977 mln.
-26.12%
1 janv. 2011
-278.628 mln.
+94.716 mln.
-25.37%
1 janv. 2012
-417.88 mln.
-139.252 mln.
49.98%
1 janv. 2013
-446.436 mln.
-28.556 mln.
6.83%
1 janv. 2014
-599.822 mln.
-153.386 mln.
34.36%
1 janv. 2015
-674.316 mln.
-74.494 mln.
12.42%
1 janv. 2016
-946.77 mln.
-272.454 mln.
40.4%
Classement des pays selon les statistiques actuelles par années

Commentaires:

Envoyer
PremiumAbout & FeedbackUn accordConfidentialité
logo
© 2022 Selected Technologies LLC – Morgan Hill, California