33
/fr/
AIzaSyB4mHJ5NPEv-XzF7P6NDYXjlkCWaeKw5bc
November 1, 2025
116636
Cyprus
CYP
true
2
1
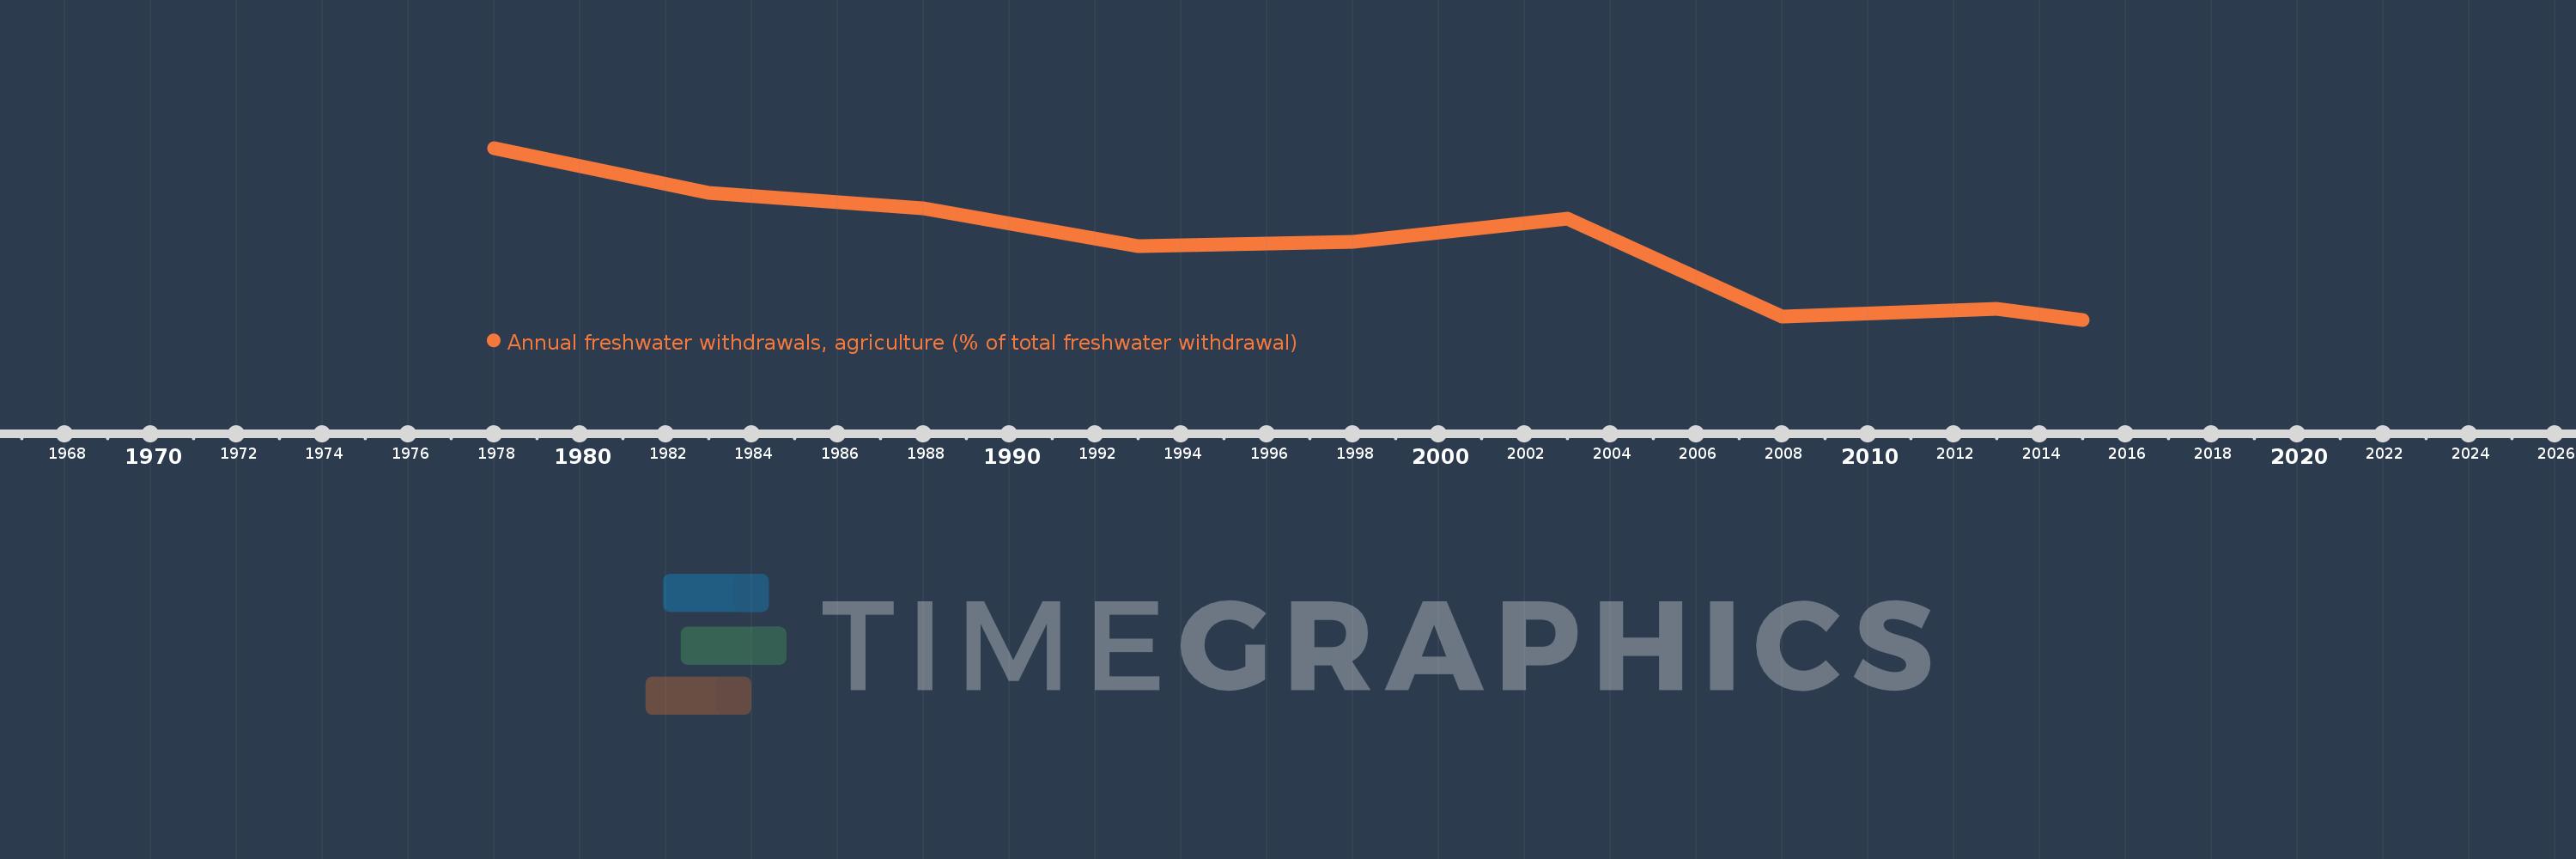
Annual freshwater withdrawals, agriculture (% of total freshwater withdrawal)
2015,2013,2008,2003,1998,1993,1988,1983,1978
Create a timeline
Public Timelines
For education
For educational institutions
For teachers
For students
Cabinet
For educational institutions
For teachers
For students
Open cabinet
FAQ
Obtenir le Premium
Close
Create a timeline
Public timelines
FAQ
About & Feedback
Un accord
Confidentialité
FAQ
Support 24/7
Cabinet
Get premium
Donate
Download
Bibliothèque de statistiques globales
→
Cyprus
→
Annual freshwater withdrawals, agriculture (% of total freshwater withdrawal)
Cette statistique dans les autres pays:
Afghanistan
Albania
Algeria
Angola
Antigua and Barbuda
Arab World
Argentina
Armenia
Australia
Austria
Azerbaijan
Bahrain
Bangladesh
Barbados
Belarus
Belgium
Belize
Benin
Bhutan
Bolivia
Botswana
Brazil
Brunei Darussalam
Bulgaria
Burkina Faso
Burundi
Cabo Verde
Cambodia
Cameroon
Canada
Caribbean small states
Central African Republic
Central Europe and the Baltics
Chad
Chile
China
Colombia
Comoros
Congo, Dem. Rep.
Congo, Rep.
Costa Rica
Cote d'Ivoire
Croatia
Cuba
Cyprus
Czech Republic
Denmark
Djibouti
Dominica
Dominican Republic
Early-demographic dividend
East Asia & Pacific
East Asia & Pacific (excluding high income)
East Asia & Pacific (IDA & IBRD countries)
Ecuador
Egypt, Arab Rep.
El Salvador
Equatorial Guinea
Eritrea
Estonia
Ethiopia
Euro area
Europe & Central Asia
Europe & Central Asia (excluding high income)
Europe & Central Asia (IDA & IBRD countries)
European Union
Fiji
Finland
Fragile and conflict affected situations
France
Gabon
Gambia, The
Georgia
Germany
Ghana
Greece
Grenada
Guatemala
Guinea
Guinea-Bissau
Guyana
Haiti
Heavily indebted poor countries (HIPC)
High income
Honduras
Hungary
IBRD only
Iceland
IDA & IBRD total
IDA blend
IDA only
IDA total
India
Indonesia
Iran, Islamic Rep.
Iraq
Ireland
Israel
Italy
Jamaica
Japan
Jordan
Kazakhstan
Kenya
Korea, Dem. People’s Rep.
Korea, Rep.
Kuwait
Kyrgyz Republic
Lao PDR
Late-demographic dividend
Latin America & Caribbean
Latin America & Caribbean (excluding high income)
Latin America & the Caribbean (IDA & IBRD countries)
Latvia
Least developed countries: UN classification
Lebanon
Lesotho
Liberia
Libya
Lithuania
Low & middle income
Low income
Lower middle income
Luxembourg
Macedonia, FYR
Madagascar
Malawi
Malaysia
Maldives
Mali
Malta
Mauritania
Mauritius
Mexico
Middle East & North Africa
Middle East & North Africa (excluding high income)
Middle East & North Africa (IDA & IBRD countries)
Middle income
Moldova
Monaco
Mongolia
Montenegro
Morocco
Mozambique
Myanmar
Namibia
Nepal
Netherlands
New Zealand
Nicaragua
Niger
Nigeria
North America
Norway
OECD members
Oman
Other small states
Pacific island small states
Pakistan
Panama
Papua New Guinea
Paraguay
Peru
Philippines
Poland
Portugal
Post-demographic dividend
Pre-demographic dividend
Puerto Rico
Qatar
Romania
Russian Federation
Rwanda
Saudi Arabia
Senegal
Serbia
Seychelles
Sierra Leone
Singapore
Slovak Republic
Slovenia
Small states
Somalia
South Africa
South Asia
South Asia (IDA & IBRD)
South Sudan
Spain
Sri Lanka
St. Kitts and Nevis
St. Lucia
St. Vincent and the Grenadines
Sub-Saharan Africa
Sub-Saharan Africa (excluding high income)
Sub-Saharan Africa (IDA & IBRD countries)
Sudan
Suriname
Swaziland
Sweden
Switzerland
Syrian Arab Republic
Tajikistan
Tanzania
Thailand
Timor-Leste
Togo
Trinidad and Tobago
Tunisia
Turkey
Turkmenistan
Uganda
Ukraine
United Arab Emirates
United Kingdom
United States
Upper middle income
Uruguay
Uzbekistan
Venezuela, RB
Vietnam
Virgin Islands (U.S.)
West Bank and Gaza
World
Yemen, Rep.
Zambia
Zimbabwe
La ligne de temps
Cette échelle de temps montre un graphique de
1978
année à
2015
année Cyprus. Les données jusqu'à
1977
année ne sont pas présentés. Quantité d'observations actuelles selon dates:
9
.
Source (désignation):
Les indicateurs du développement mondiale
Source (organisation):
Food and Agriculture Organization, AQUASTAT data.
Catégories:
Agriculture & Rural Development, Infrastructure, Environment
Dernière mise à jour
23 avr. 2017
Les indicateurs de changement de valeurs selon les années
En moyenne:
73.641
Minimum:
65.65
1 janv. 2015
Maximum:
83.87
1 janv. 1978
Pour la date d''observation
Valeur
Changement absolu
Le changement par rapport à la valeur précédente
1 janv. 1978
83.87
+83.87
0.0%
1 janv. 1983
79.1
-4.77
-5.69%
1 janv. 1988
77.5
-1.6
-2.02%
1 janv. 1993
73.45
-4.05
-5.23%
1 janv. 1998
73.93
+0.48
0.65%
1 janv. 2003
76.4
+2.47
3.34%
1 janv. 2008
66.02
-10.38
-13.59%
1 janv. 2013
66.85
+0.83
1.26%
1 janv. 2015
65.65
-1.2
-1.8%
Classement des pays selon les statistiques actuelles par années
About & Feedback
Un accord
Confidentialité
FAQ
Support 24/7
Cabinet
Get premium
Donate
The service accepts bank transfer (ACH, Wire) or cards (Visa, MasterCard, etc). Processed by Stripe.
Secured with SSL