29
/fr/
fr
AIzaSyAYiBZKx7MnpbEhh9jyipgxe19OcubqV5w
April 1, 2024
115381
Croatia
HRV
true
2
1
Social contributions (% of revenue)
2015,2014,2013,2012,2011,2010,2009,2008,2007,2006,2005,2004,2003,2002,2001,2000,1999,1998,1997,1996,1995,1994,1993,1992
Download
Bibliothèque de statistiques globales →Croatia →

Social contributions (% of revenue)

Cette statistique dans les autres pays:
AfghanistanAlbaniaAngolaArgentinaArmeniaAustraliaAustriaAzerbaijanBarbadosBelarusBelgiumBelizeBeninBhutanBoliviaBosnia and HerzegovinaBrazilBulgariaBurundiCabo VerdeCanadaCaribbean small statesCentral African RepublicCentral Europe and the BalticsChileChinaColombiaCongo, Rep.Costa RicaCote d'IvoireCroatiaCyprusCzech RepublicDenmarkDominican RepublicEgypt, Arab Rep.El SalvadorEstoniaEthiopiaEuro areaEurope & Central AsiaEurope & Central Asia (excluding high income)Europe & Central Asia (IDA & IBRD countries)European UnionFijiFinlandFranceGambia, TheGeorgiaGermanyGhanaGreeceGuatemalaHigh incomeHondurasHong Kong SAR, ChinaHungaryIBRD onlyIcelandIDA blendIndiaIndonesiaIran, Islamic Rep.IraqIrelandIsraelItalyJamaicaJapanJordanKazakhstanKenyaKorea, Rep.Late-demographic dividendLatin America & Caribbean Latin America & Caribbean (excluding high income)Latin America & the Caribbean (IDA & IBRD countries)LatviaLebanonLiberiaLithuaniaLuxembourgMacao SAR, ChinaMacedonia, FYRMadagascarMaltaMauritiusMexicoMoldovaMongoliaMoroccoMozambiqueNamibiaNetherlandsNew ZealandNorth AmericaNorwayOECD membersPanamaPapua New GuineaParaguayPeruPolandPortugalPost-demographic dividendRomaniaRussian FederationSan MarinoSao Tome and PrincipeSerbiaSeychellesSlovak RepublicSloveniaSmall statesSouth AfricaSouth AsiaSouth Asia (IDA & IBRD)SpainSri LankaSt. Kitts and NevisSwedenSwitzerlandSyrian Arab RepublicTajikistanThailandTrinidad and TobagoTunisiaTurkeyUkraineUnited Arab EmiratesUnited KingdomUnited StatesUpper middle incomeUruguayVenezuela, RBZambiaZimbabwe
La ligne de temps
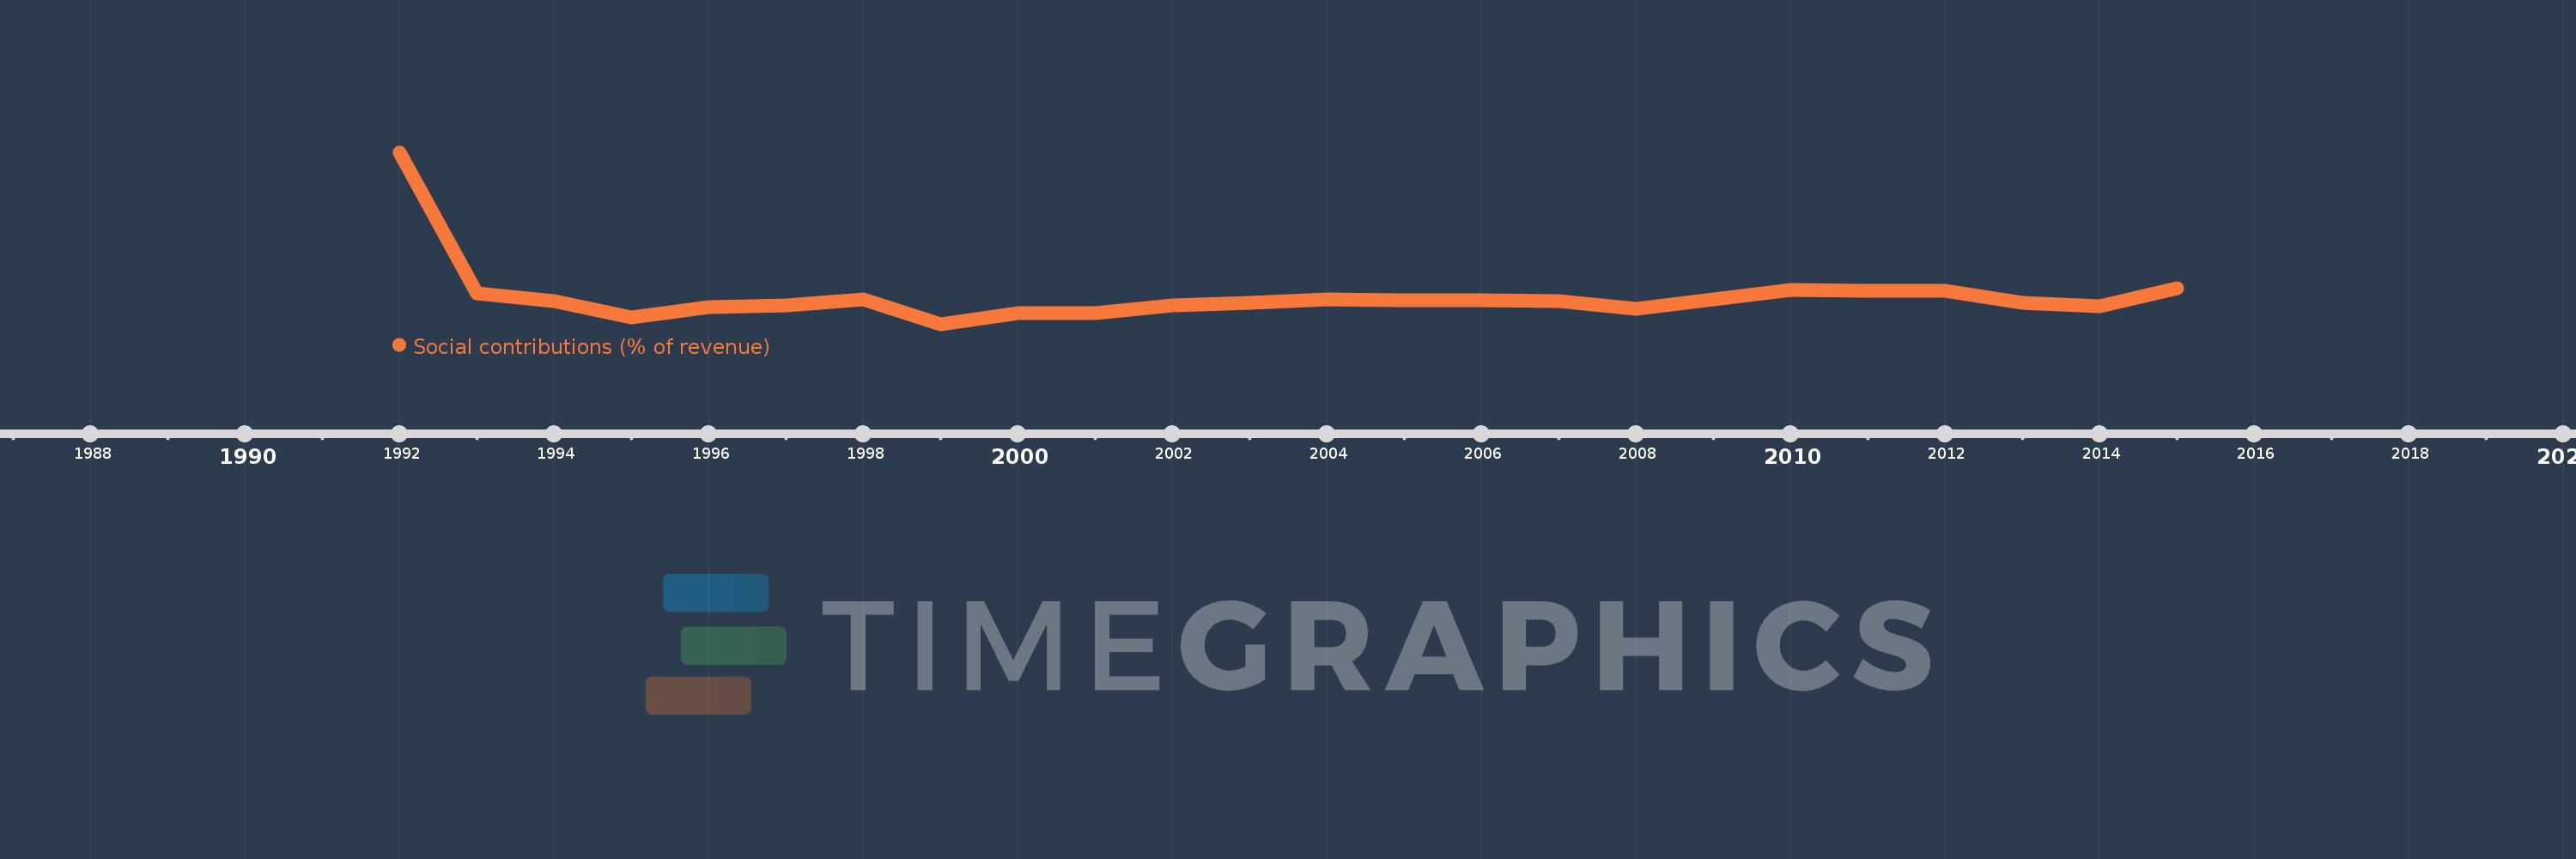
Cette échelle de temps montre un graphique de 1992 année à 2015 année Croatia. Les données jusqu'à 1991 année ne sont pas présentés. Quantité d'observations actuelles selon dates: 24.
Source (désignation):
Les indicateurs du développement mondiale
Source (organisation):
International Monetary Fund, Government Finance Statistics Yearbook and data files.
Catégories:
Public Sector
Dernière mise à jour
23 avr. 2017
Les indicateurs de changement de valeurs selon les années
En moyenne:
34.303
Minimum:
30.962
1 janv. 1999
Maximum:
51.532
1 janv. 1992
Pour la date d''observation
Valeur
Changement absolu
Le changement par rapport à la valeur précédente
1 janv. 1992
51.532
+51.532
0.0%
1 janv. 1993
34.694
-16.838
-32.67%
1 janv. 1994
33.688
-1.006
-2.9%
1 janv. 1995
31.77
-1.919
-5.7%
1 janv. 1996
32.98
+1.21
3.81%
1 janv. 1997
33.229
+0.249
0.75%
1 janv. 1998
33.977
+0.748
2.25%
1 janv. 1999
30.962
-3.015
-8.87%
1 janv. 2000
32.274
+1.313
4.24%
1 janv. 2001
32.322
+0.048
0.15%
1 janv. 2002
33.257
+0.935
2.89%
1 janv. 2003
33.571
+0.314
0.95%
1 janv. 2004
33.947
+0.376
1.12%
1 janv. 2005
33.875
-0.072
-0.21%
1 janv. 2006
33.787
-0.088
-0.26%
1 janv. 2007
33.744
-0.043
-0.13%
1 janv. 2008
32.812
-0.933
-2.76%
1 janv. 2009
33.91
+1.098
3.35%
1 janv. 2010
35.056
+1.147
3.38%
1 janv. 2011
34.929
-0.127
-0.36%
1 janv. 2012
34.966
+0.037
0.11%
1 janv. 2013
33.526
-1.44
-4.12%
1 janv. 2014
33.154
-0.373
-1.11%
1 janv. 2015
35.32
+2.166
6.53%
Classement des pays selon les statistiques actuelles par années

Commentaires:

Envoyer
PremiumAbout & FeedbackUn accordConfidentialité
logo
© 2022 Selected Technologies LLC – Morgan Hill, California