29
/fr/
fr
AIzaSyAYiBZKx7MnpbEhh9jyipgxe19OcubqV5w
April 1, 2024
114305
Cote d'Ivoire
CIV
true
2
1
Share of tariff lines with international peaks, manufactured products (%)
2016,2015,2014,2013,2012,2011,2010,2009,2008,2007,2006,2005,2004,2003,2002,1997,1994
Download
Bibliothèque de statistiques globales →Cote d'Ivoire →

Share of tariff lines with international peaks, manufactured products (%)

Cette statistique dans les autres pays:
AfghanistanAlbaniaAlgeriaAngolaAntigua and BarbudaArgentinaArmeniaArubaAustraliaAustriaAzerbaijanBahamas, TheBahrainBangladeshBarbadosBelarusBelgiumBelizeBeninBermudaBhutanBoliviaBosnia and HerzegovinaBotswanaBrazilBrunei DarussalamBulgariaBurkina FasoBurundiCabo VerdeCambodiaCameroonCanadaCentral African RepublicChadChileChinaColombiaComorosCongo, Dem. Rep.Congo, Rep.Costa RicaCote d'IvoireCroatiaCubaCyprusCzech RepublicDenmarkDjiboutiDominicaDominican RepublicEast Asia & Pacific (excluding high income)EcuadorEgypt, Arab Rep.El SalvadorEquatorial GuineaEritreaEstoniaEthiopiaEurope & Central Asia (excluding high income)European UnionFijiFinlandFranceFrench PolynesiaGabonGambia, TheGeorgiaGermanyGhanaGreeceGrenadaGuatemalaGuineaGuinea-BissauGuyanaHaitiHigh incomeHondurasHong Kong SAR, ChinaHungaryIcelandIndiaIndonesiaIran, Islamic Rep.IrelandIsraelItalyJamaicaJapanJordanKazakhstanKenyaKorea, Rep.KuwaitKyrgyz RepublicLao PDRLatin America & Caribbean (excluding high income)LatviaLebanonLesothoLiberiaLibyaLithuaniaLow & middle incomeLow incomeLower middle incomeLuxembourgMacao SAR, ChinaMacedonia, FYRMadagascarMalawiMalaysiaMaldivesMaliMaltaMauritaniaMauritiusMexicoMiddle East & North Africa (excluding high income)Middle incomeMoldovaMongoliaMontenegroMoroccoMozambiqueMyanmarNamibiaNepalNetherlandsNew ZealandNicaraguaNigerNigeriaNorwayOECD membersOmanPakistanPalauPanamaPapua New GuineaParaguayPeruPhilippinesPolandPortugalQatarRomaniaRussian FederationRwandaSamoaSaudi ArabiaSenegalSerbiaSeychellesSierra LeoneSingaporeSlovak RepublicSloveniaSolomon IslandsSouth AfricaSouth AsiaSpainSri LankaSt. Kitts and NevisSt. LuciaSt. Vincent and the GrenadinesSub-Saharan Africa (excluding high income)SudanSurinameSwazilandSwedenSwitzerlandSyrian Arab RepublicTajikistanTanzaniaThailandTimor-LesteTogoTongaTrinidad and TobagoTunisiaTurkeyTurkmenistanTuvaluUgandaUkraineUnited Arab EmiratesUnited KingdomUnited StatesUpper middle incomeUruguayUzbekistanVanuatuVenezuela, RBVietnamWorldYemen, Rep.ZambiaZimbabwe
La ligne de temps
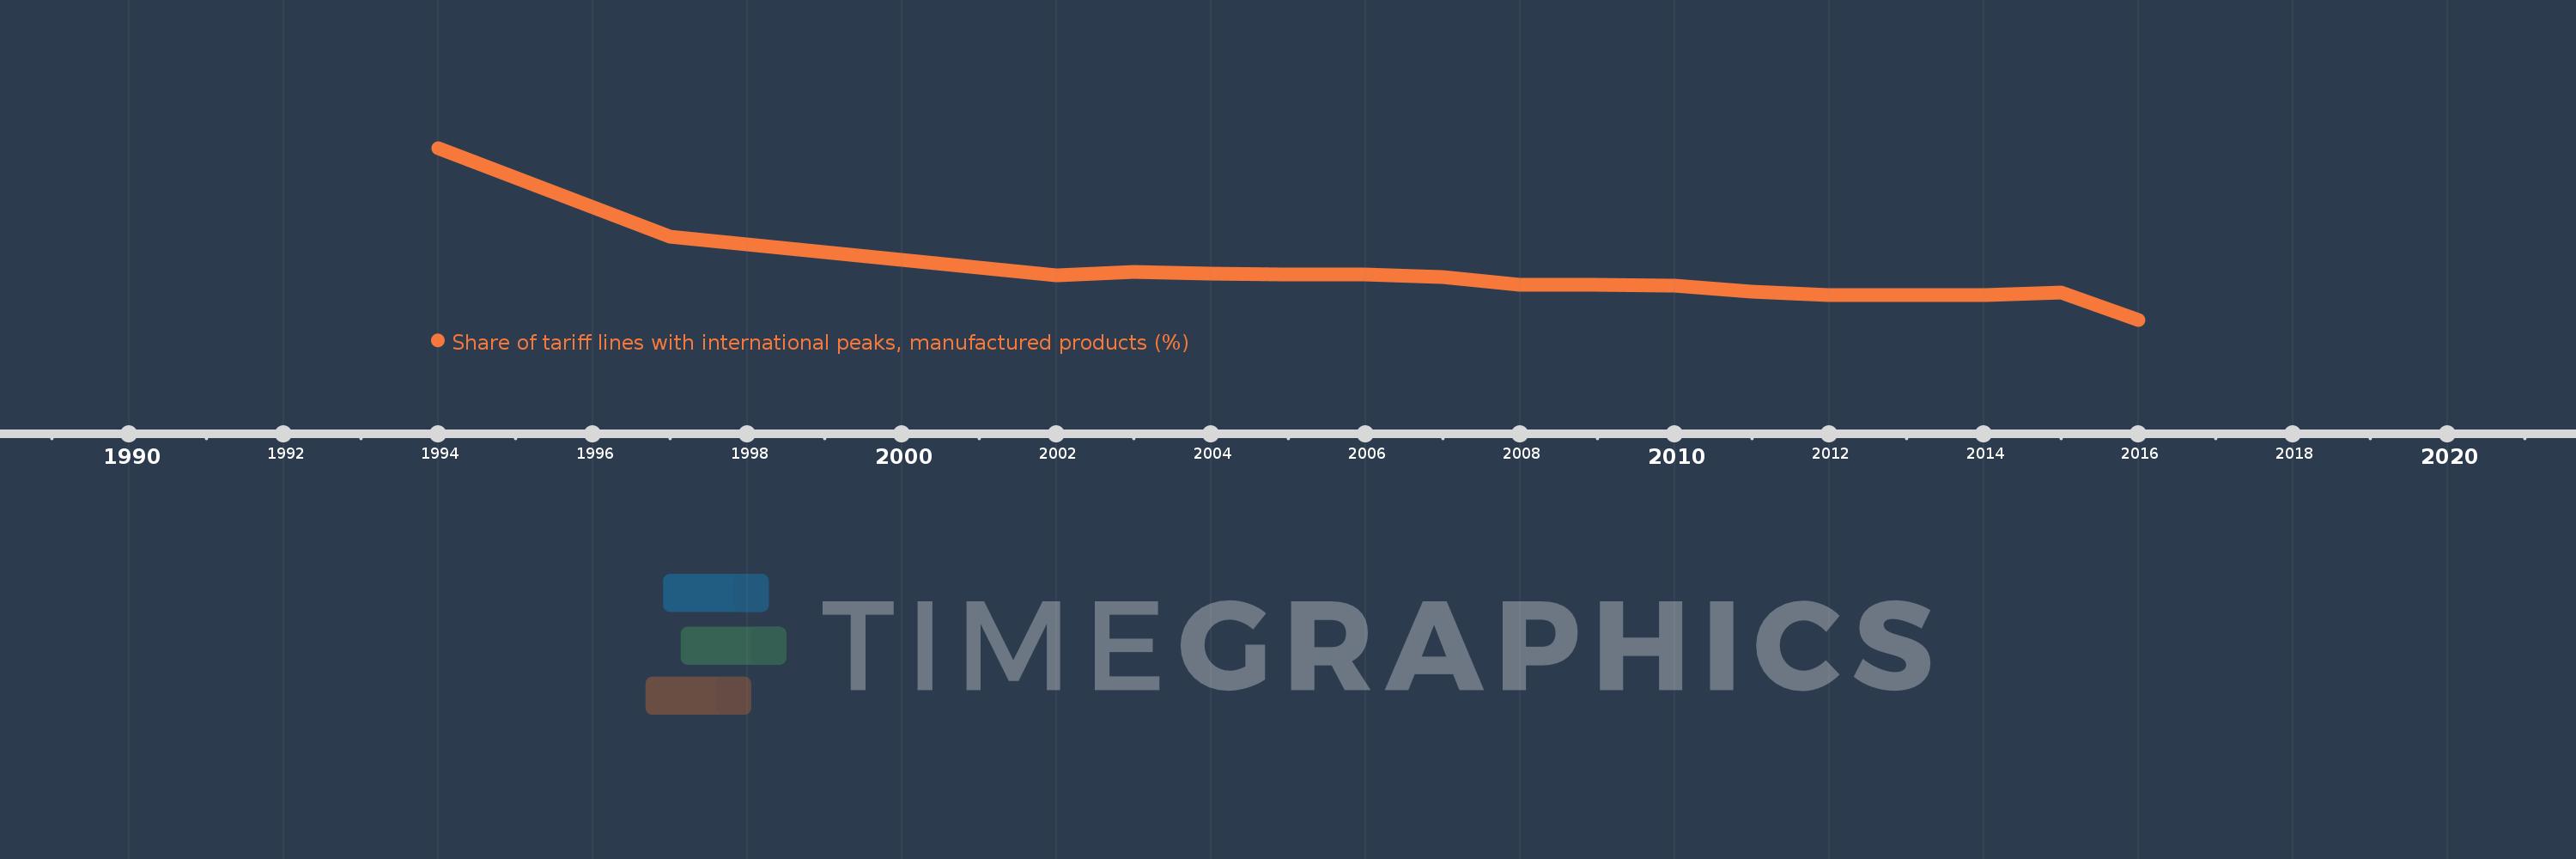
Cette échelle de temps montre un graphique de 1994 année à 2016 année Cote d'Ivoire. Les données jusqu'à 1993 année ne sont pas présentés. Quantité d'observations actuelles selon dates: 17.
Source (désignation):
Les indicateurs du développement mondiale
Source (organisation):
World Bank staff estimates using the World Integrated Trade Solution system, based on data from United Nations Conference on Trade and Development's Trade Analysis and Information System (TRAINS) database.
Catégories:
Private Sector, Trade
Dernière mise à jour
23 avr. 2017
Les indicateurs de changement de valeurs selon les années
En moyenne:
48.946
Minimum:
40.267
1 janv. 2016
Maximum:
73.61
1 janv. 1994
Pour la date d''observation
Valeur
Changement absolu
Le changement par rapport à la valeur précédente
1 janv. 1994
73.61
+73.61
0.0%
1 janv. 1997
56.466
-17.144
-23.29%
1 janv. 2002
48.956
-7.509
-13.3%
1 janv. 2003
49.567
+0.611
1.25%
1 janv. 2004
49.227
-0.34
-0.69%
1 janv. 2005
49.114
-0.113
-0.23%
1 janv. 2006
49.056
-0.058
-0.12%
1 janv. 2007
48.632
-0.424
-0.87%
1 janv. 2008
47.071
-1.561
-3.21%
1 janv. 2009
47.066
-0.004
-0.01%
1 janv. 2010
46.847
-0.22
-0.47%
1 janv. 2011
45.649
-1.198
-2.56%
1 janv. 2012
44.98
-0.669
-1.46%
1 janv. 2013
45.02
+0.04
0.09%
1 janv. 2014
45.02
0.0
0.0%
1 janv. 2015
45.536
+0.516
1.15%
1 janv. 2016
40.267
-5.269
-11.57%
Classement des pays selon les statistiques actuelles par années

Commentaires:

Envoyer
PremiumAbout & FeedbackUn accordConfidentialité
logo
© 2022 Selected Technologies LLC – Morgan Hill, California