33
/fr/
AIzaSyB4mHJ5NPEv-XzF7P6NDYXjlkCWaeKw5bc
November 1, 2025
113643
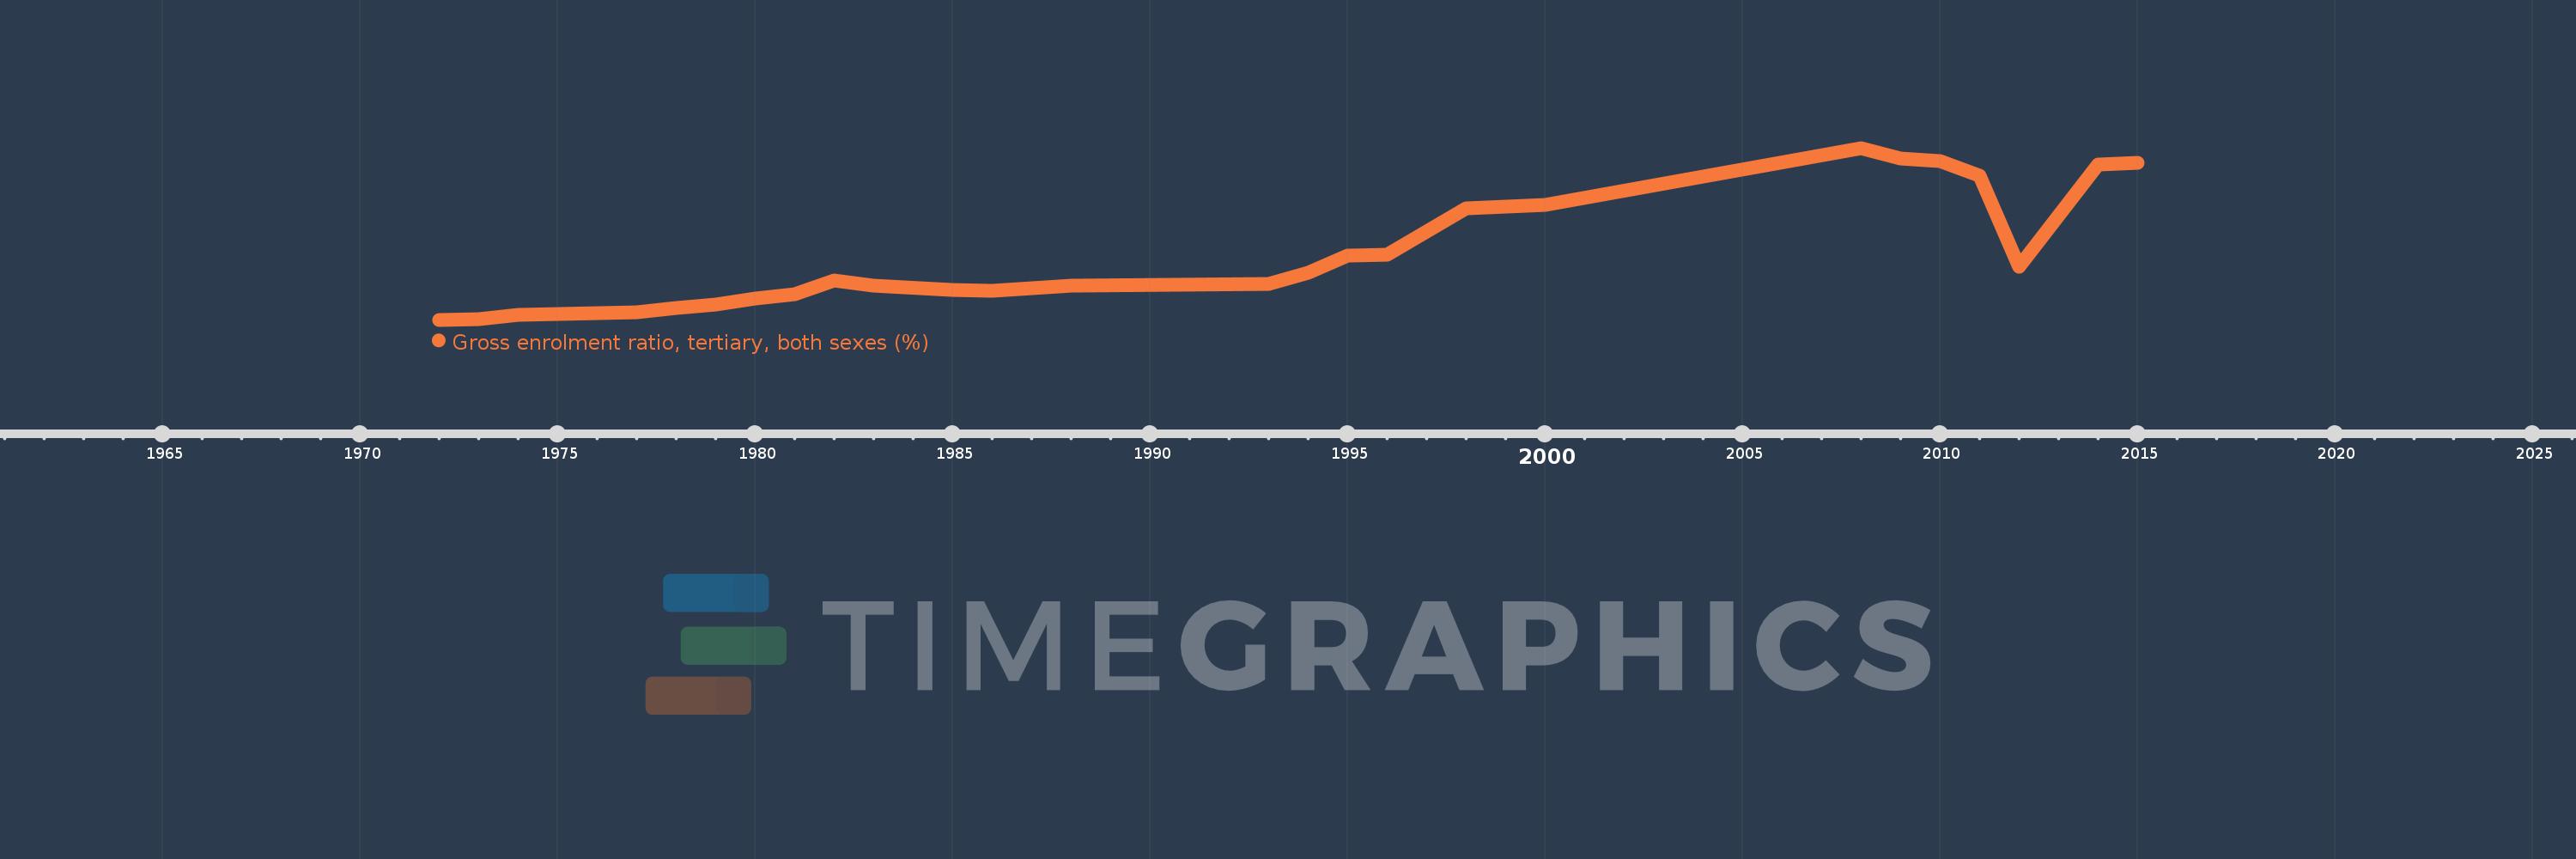
Cote d'Ivoire
CIV
true
2
1
Gross enrolment ratio, tertiary, both sexes (%)
2015,2014,2012,2011,2010,2009,2008,2000,1998,1996,1995,1994,1993,1988,1986,1985,1983,1982,1981,1980,1979,1978,1977,1975,1974,1973,1972