33
/fr/
AIzaSyAYiBZKx7MnpbEhh9jyipgxe19OcubqV5w
May 1, 2025
110791
Congo, Rep.
COG
true
2
1
Depositors with commercial banks (per 1,000 adults)
2016,2015,2014,2013,2012,2011,2010,2009,2008,2007,2006,2005
Download
Bibliothèque de statistiques globales →Congo, Rep. →

Depositors with commercial banks (per 1,000 adults)

Cette statistique dans les autres pays:

AfghanistanAngolaArab WorldArgentinaAzerbaijanBangladeshBelizeBeninBotswanaBrazilBrunei DarussalamBurkina FasoBurundiCabo VerdeCameroonCentral African RepublicChadChinaColombiaComorosCongo, Dem. Rep.Congo, Rep.Costa RicaCote d'IvoireCroatiaDjiboutiDominican RepublicEarly-demographic dividendEast Asia & Pacific (excluding high income)East Asia & Pacific (IDA & IBRD countries)EcuadorEgypt, Arab Rep.Equatorial GuineaEstoniaEthiopiaFragile and conflict affected situationsGabonGeorgiaGhanaGuineaGuinea-BissauHaitiHeavily indebted poor countries (HIPC)HungaryIBRD onlyIDA & IBRD totalIDA blendIDA onlyIDA totalIsraelItalyKenyaKiribatiKuwaitKyrgyz RepublicLao PDRLatin America & Caribbean (excluding high income)Latin America & the Caribbean (IDA & IBRD countries)LatviaLeast developed countries: UN classificationLebanonLesothoLibyaLow & middle incomeLow incomeLower middle incomeMadagascarMalawiMalaysiaMaldivesMaliMaltaMauritaniaMiddle East & North AfricaMiddle East & North Africa (excluding high income)Middle East & North Africa (IDA & IBRD countries)Middle incomeMoldovaMyanmarNamibiaNigerNigeriaNorwayOther small statesPakistanPalauParaguayPeruPhilippinesPolandPre-demographic dividendQatarRwandaSamoaSan MarinoSao Tome and PrincipeSaudi ArabiaSenegalSeychellesSierra LeoneSingaporeSmall statesSolomon IslandsSouth AsiaSouth Asia (IDA & IBRD)South SudanSub-Saharan Africa Sub-Saharan Africa (excluding high income)Sub-Saharan Africa (IDA & IBRD countries)SurinameSwazilandSyrian Arab RepublicTajikistanTanzaniaThailandTimor-LesteTogoTunisiaTurkeyUgandaUkraineUpper middle incomeUruguayUzbekistanVanuatuVenezuela, RBWest Bank and GazaWorldYemen, Rep.ZambiaZimbabwe

La ligne de temps

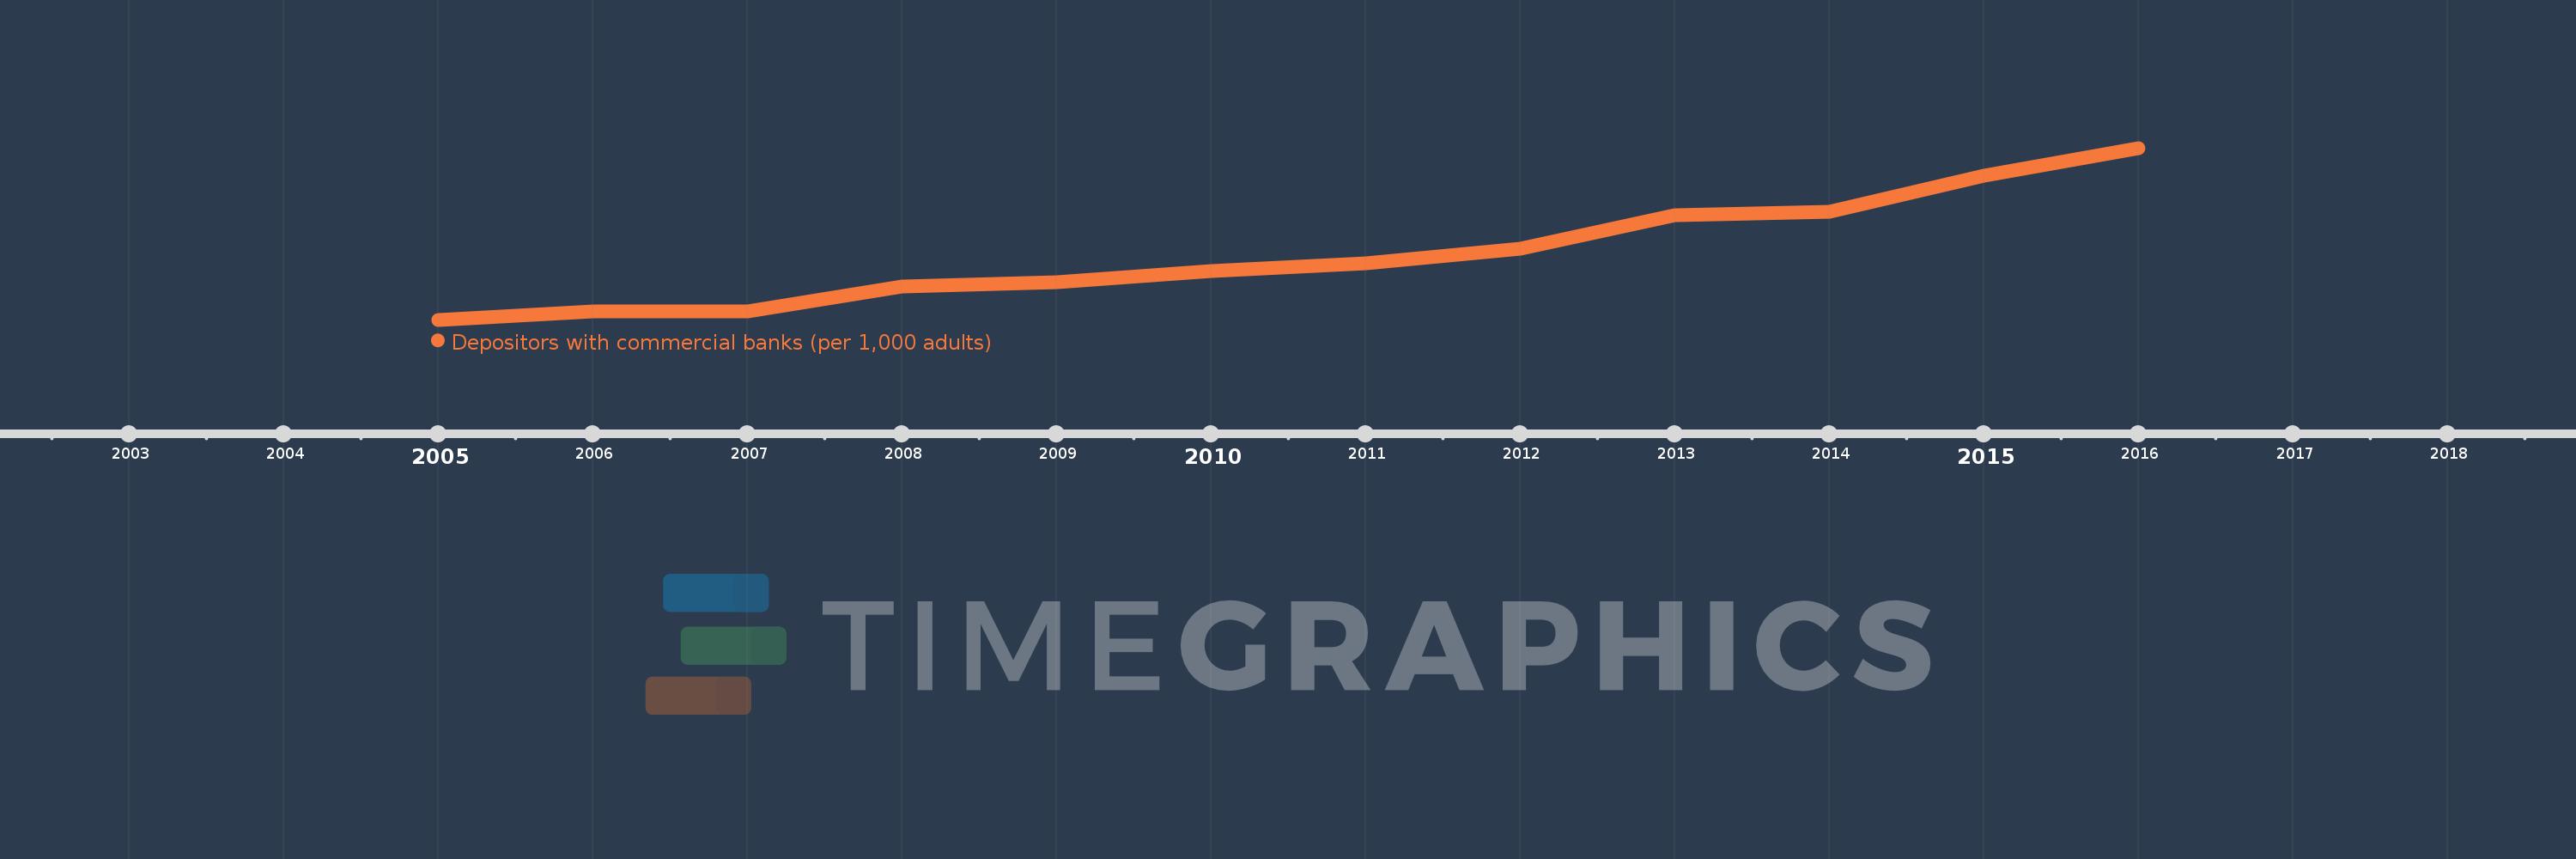
Cette échelle de temps montre un graphique de 2005 année à 2016 année Congo, Rep.. Les données jusqu'à 2004 année ne sont pas présentés. Quantité d'observations actuelles selon dates: 12.

Source (désignation):

Les indicateurs du développement mondiale

Source (organisation):

International Monetary Fund, Financial Access Survey.

Catégories:

Financial Sector

Dernière mise à jour

23 avr. 2017

Les indicateurs de changement de valeurs selon les années

En moyenne:
65.22
Minimum:
15.015
1 janv. 2005
Maximum:
145.551
1 janv. 2016
Pour la date d''observation
Valeur
Changement absolu
Le changement par rapport à la valeur précédente
1 janv. 2005
15.015
+15.015
0.0%
1 janv. 2006
21.376
+6.361
42.37%
1 janv. 2007
21.564
+0.187
0.88%
1 janv. 2008
40.51
+18.946
87.86%
1 janv. 2009
43.78
+3.27
8.07%
1 janv. 2010
51.826
+8.046
18.38%
1 janv. 2011
58.022
+6.196
11.96%
1 janv. 2012
69.088
+11.065
19.07%
1 janv. 2013
94.264
+25.176
36.44%
1 janv. 2014
97.34
+3.076
3.26%
1 janv. 2015
124.299
+26.959
27.7%
1 janv. 2016
145.551
+21.252
17.1%

Classement des pays selon les statistiques actuelles par années