33
/fr/
AIzaSyAYiBZKx7MnpbEhh9jyipgxe19OcubqV5w
August 1, 2025
106262
China
CHN
true
2
1
Military expenditure (% of GDP)
2016,2015,2014,2013,2012,2011,2010,2009,2008,2007,2006,2005,2004,2003,2002,2001,2000,1999,1998,1997,1996,1995,1994,1993,1992,1991,1990
Download
Bibliothèque de statistiques globales →China →

Military expenditure (% of GDP)

Cette statistique dans les autres pays:

AfghanistanAlbaniaAlgeriaAngolaArab WorldArgentinaArmeniaAustraliaAustriaAzerbaijanBahrainBangladeshBelarusBelgiumBelizeBeninBoliviaBosnia and HerzegovinaBotswanaBrazilBrunei DarussalamBulgariaBurkina FasoBurundiCabo VerdeCambodiaCameroonCanadaCaribbean small statesCentral African RepublicCentral Europe and the BalticsChadChileChinaColombiaCongo, Dem. Rep.Congo, Rep.Costa RicaCote d'IvoireCroatiaCubaCyprusCzech RepublicDenmarkDjiboutiDominican RepublicEarly-demographic dividendEast Asia & PacificEast Asia & Pacific (excluding high income)East Asia & Pacific (IDA & IBRD countries)EcuadorEgypt, Arab Rep.El SalvadorEquatorial GuineaEritreaEstoniaEthiopiaEuro areaEurope & Central AsiaEurope & Central Asia (excluding high income)Europe & Central Asia (IDA & IBRD countries)European UnionFijiFinlandFragile and conflict affected situationsFranceGabonGambia, TheGeorgiaGermanyGhanaGreeceGuatemalaGuineaGuinea-BissauGuyanaHaitiHeavily indebted poor countries (HIPC)High incomeHondurasHungaryIBRD onlyIcelandIDA & IBRD totalIDA blendIDA onlyIDA totalIndiaIndonesiaIran, Islamic Rep.IraqIrelandIsraelItalyJamaicaJapanJordanKazakhstanKenyaKorea, Rep.KosovoKuwaitKyrgyz RepublicLao PDRLate-demographic dividendLatin America & Caribbean Latin America & Caribbean (excluding high income)Latin America & the Caribbean (IDA & IBRD countries)LatviaLeast developed countries: UN classificationLebanonLesothoLiberiaLibyaLithuaniaLow & middle incomeLow incomeLower middle incomeLuxembourgMacedonia, FYRMadagascarMalawiMalaysiaMaliMaltaMauritaniaMauritiusMexicoMiddle East & North AfricaMiddle East & North Africa (excluding high income)Middle East & North Africa (IDA & IBRD countries)Middle incomeMoldovaMongoliaMontenegroMoroccoMozambiqueMyanmarNamibiaNepalNetherlandsNew ZealandNicaraguaNigerNigeriaNorth AmericaNorwayOECD membersOmanOther small statesPakistanPanamaPapua New GuineaParaguayPeruPhilippinesPolandPortugalPost-demographic dividendPre-demographic dividendQatarRomaniaRussian FederationRwandaSaudi ArabiaSenegalSerbiaSeychellesSierra LeoneSingaporeSlovak RepublicSloveniaSmall statesSomaliaSouth AfricaSouth AsiaSouth Asia (IDA & IBRD)South SudanSpainSri LankaSub-Saharan Africa Sub-Saharan Africa (excluding high income)Sub-Saharan Africa (IDA & IBRD countries)SudanSwazilandSwedenSwitzerlandSyrian Arab RepublicTajikistanTanzaniaThailandTimor-LesteTogoTrinidad and TobagoTunisiaTurkeyTurkmenistanUgandaUkraineUnited Arab EmiratesUnited KingdomUnited StatesUpper middle incomeUruguayUzbekistanVenezuela, RBVietnamWorldYemen, Rep.ZambiaZimbabwe

La ligne de temps

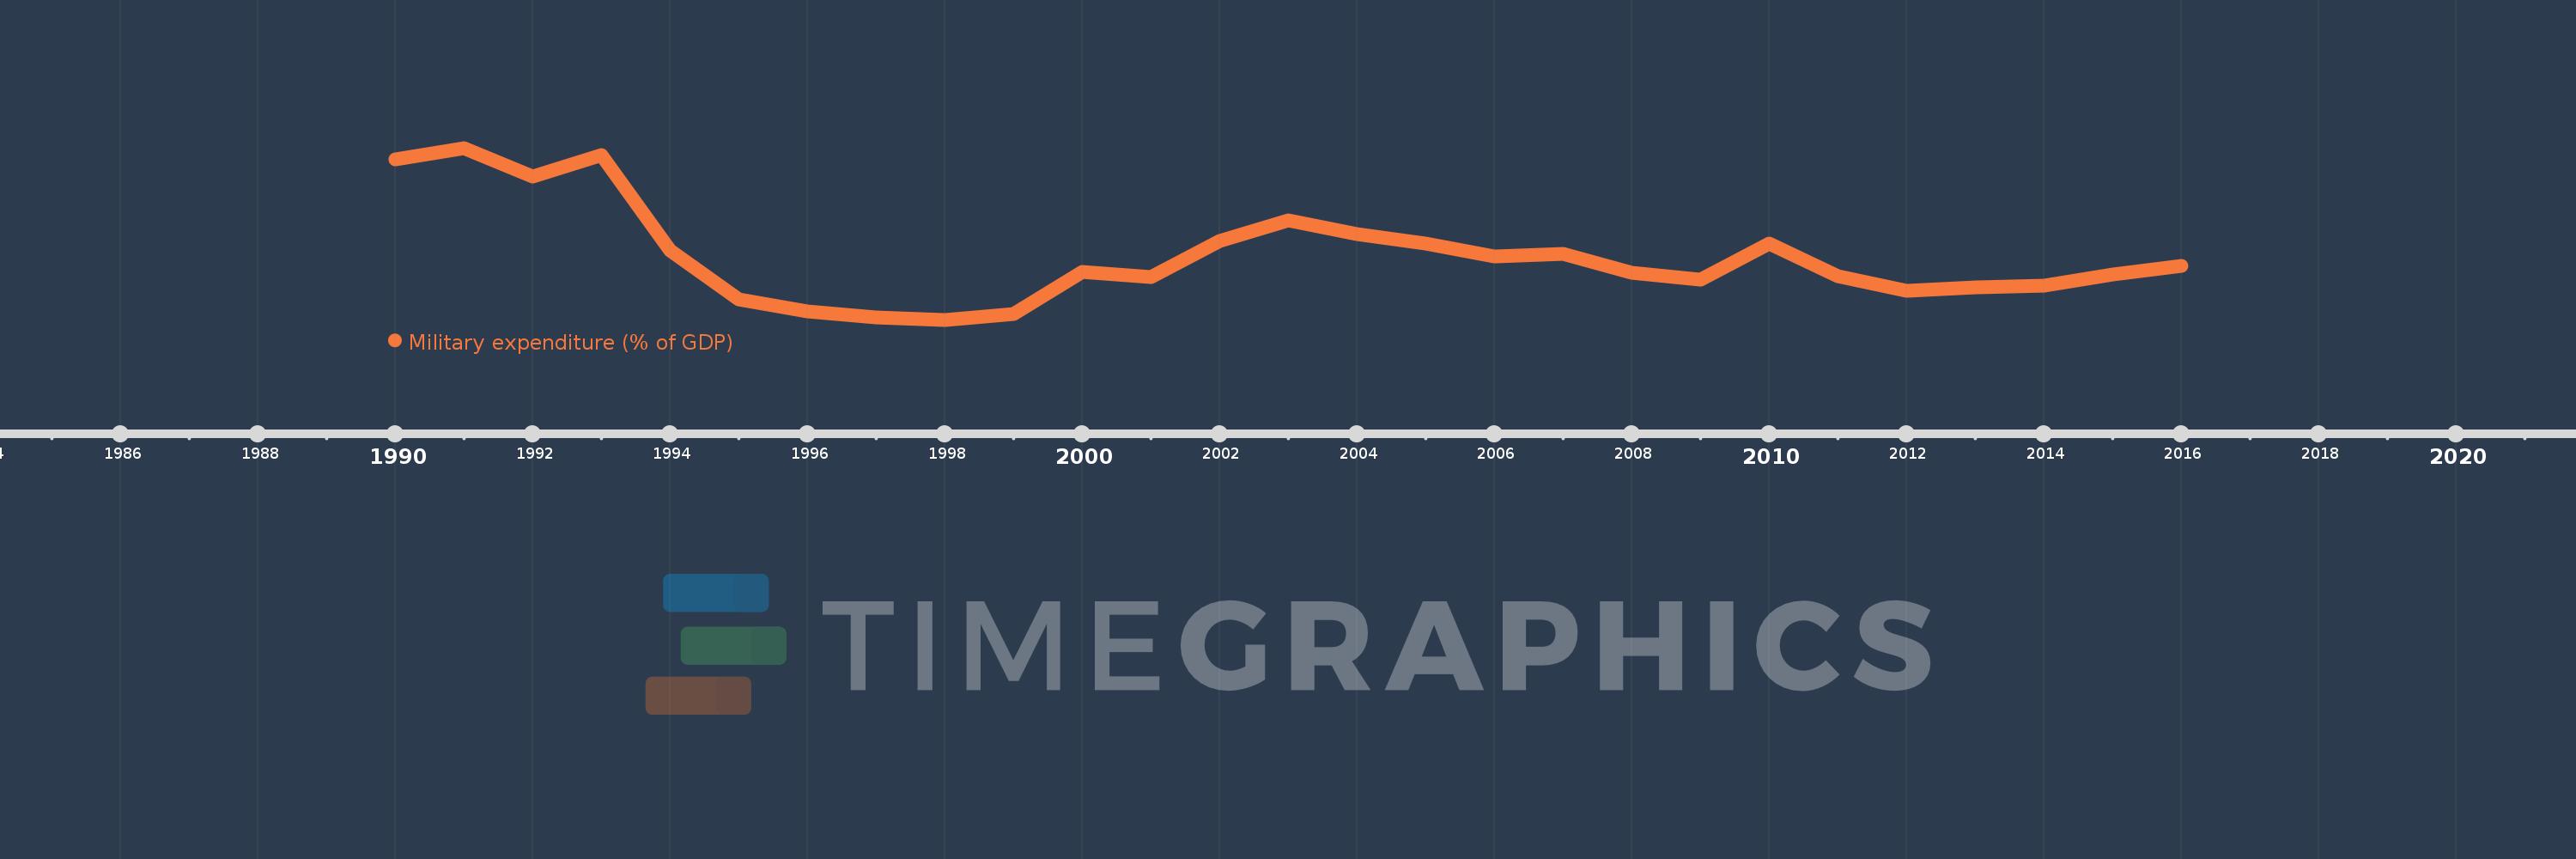
Cette échelle de temps montre un graphique de 1990 année à 2016 année China. Les données jusqu'à 1989 année ne sont pas présentés. Quantité d'observations actuelles selon dates: 27.

Source (désignation):

Les indicateurs du développement mondiale

Source (organisation):

Stockholm International Peace Research Institute (SIPRI), Yearbook: Armaments, Disarmament and International Security.

Catégories:

Public Sector

Dernière mise à jour

23 avr. 2017

Les indicateurs de changement de valeurs selon les années

En moyenne:
1.999
Minimum:
1.675
1 janv. 1998
Maximum:
2.556
1 janv. 1991
Pour la date d''observation
Valeur
Changement absolu
Le changement par rapport à la valeur précédente
1 janv. 1990
2.499
+2.499
0.0%
1 janv. 1991
2.556
+0.057
2.27%
1 janv. 1992
2.408
-0.148
-5.79%
1 janv. 1993
2.519
+0.111
4.6%
1 janv. 1994
2.031
-0.487
-19.34%
1 janv. 1995
1.781
-0.25
-12.33%
1 janv. 1996
1.716
-0.065
-3.63%
1 janv. 1997
1.686
-0.03
-1.76%
1 janv. 1998
1.675
-0.011
-0.67%
1 janv. 1999
1.703
+0.028
1.7%
1 janv. 2000
1.922
+0.219
12.84%
1 janv. 2001
1.893
-0.029
-1.51%
1 janv. 2002
2.081
+0.188
9.94%
1 janv. 2003
2.185
+0.104
5.01%
1 janv. 2004
2.116
-0.07
-3.19%
1 janv. 2005
2.064
-0.052
-2.46%
1 janv. 2006
2.0
-0.063
-3.07%
1 janv. 2007
2.011
+0.01
0.51%
1 janv. 2008
1.917
-0.094
-4.67%
1 janv. 2009
1.879
-0.038
-1.96%
1 janv. 2010
2.067
+0.188
10.0%
1 janv. 2011
1.897
-0.171
-8.26%
1 janv. 2012
1.822
-0.075
-3.93%
1 janv. 2013
1.839
+0.017
0.95%
1 janv. 2014
1.851
+0.012
0.65%
1 janv. 2015
1.905
+0.053
2.89%
1 janv. 2016
1.951
+0.046
2.43%

Classement des pays selon les statistiques actuelles par années