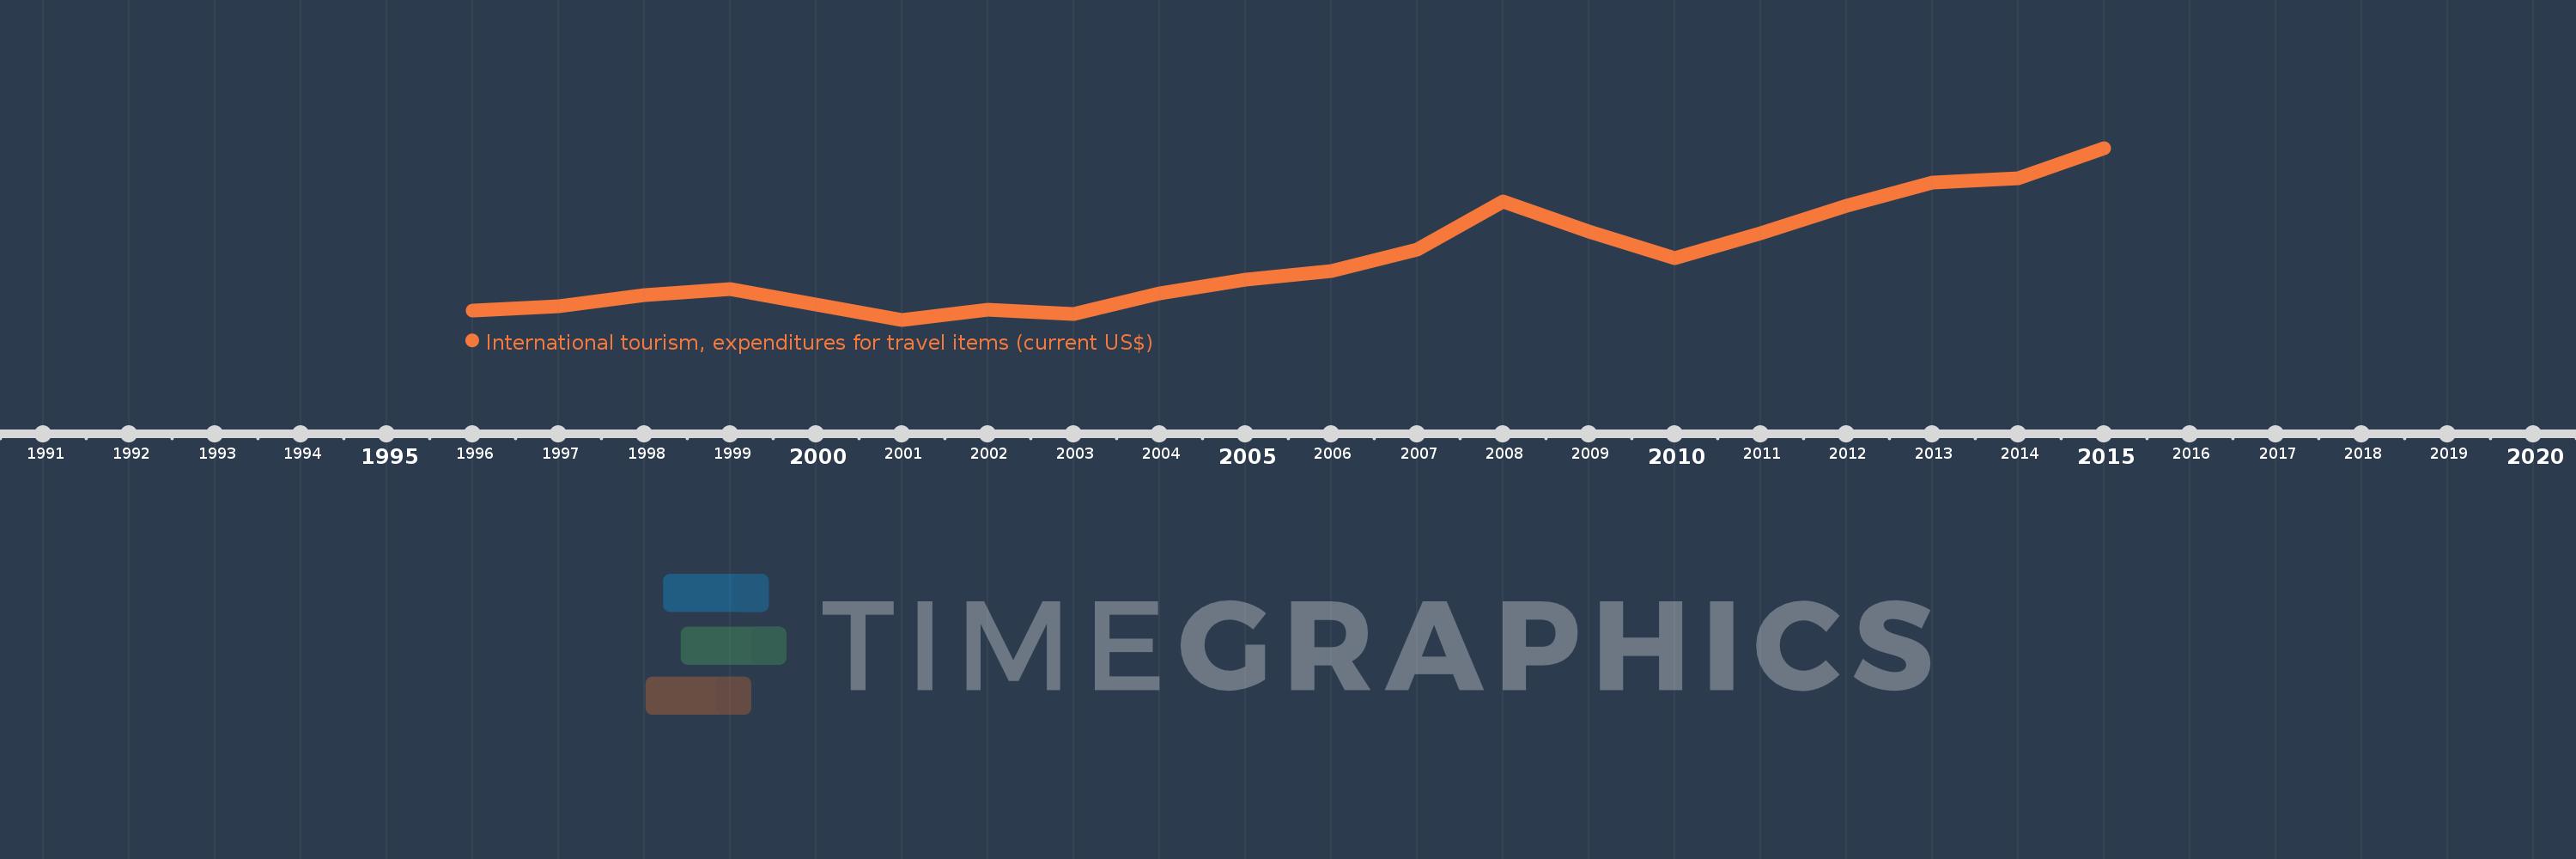
Cette échelle de temps montre un graphique de 1996 année à 2015 année Chile. Les données jusqu'à 1995 année ne sont pas présentés. Quantité d'observations actuelles selon dates: 20.
Source (désignation):
Les indicateurs du développement mondiale
Source (organisation):
World Tourism Organization, Yearbook of Tourism Statistics, Compendium of Tourism Statistics and data files.
Catégories:
Private Sector, Trade
Dernière mise à jour
23 avr. 2017
Les indicateurs de changement de valeurs selon les années
En moyenne:
1.155 mds
Minimum:
620.0 mln.
1 janv. 2001
Maximum:
2.136 mds
1 janv. 2015
Pour la date d''observation
Valeur
Changement absolu
Le changement par rapport à la valeur précédente
1 janv. 1996
703.0 mln.
+703.0 mln.
0.0%
1 janv. 1997
736.0 mln.
+33.0 mln.
4.69%
1 janv. 1998
839.0 mln.
+103.0 mln.
13.99%
1 janv. 1999
888.0 mln.
+49.0 mln.
5.84%
1 janv. 2000
752.0 mln.
-136.0 mln.
-15.32%
1 janv. 2001
620.0 mln.
-132.0 mln.
-17.55%
1 janv. 2002
708.0 mln.
+88.0 mln.
14.19%
1 janv. 2003
673.0 mln.
-35.0 mln.
-4.94%
1 janv. 2004
850.0 mln.
+177.0 mln.
26.3%
1 janv. 2005
977.0 mln.
+127.0 mln.
14.94%
1 janv. 2006
1.051 mds
+74.0 mln.
7.57%
1 janv. 2007
1.239 mds
+188.0 mln.
17.89%
1 janv. 2008
1.66 mds
+421.0 mln.
33.98%
1 janv. 2009
1.397 mds
-263.0 mln.
-15.84%
1 janv. 2010
1.167 mds
-230.0 mln.
-16.46%
1 janv. 2011
1.383 mds
+216.0 mln.
18.51%
1 janv. 2012
1.624 mds
+241.0 mln.
17.43%
1 janv. 2013
1.833 mds
+209.0 mln.
12.87%
1 janv. 2014
1.867 mds
+34.0 mln.
1.85%
1 janv. 2015
2.136 mds
+269.0 mln.
14.41%
Classement des pays selon les statistiques actuelles par années