33
/fr/
AIzaSyAYiBZKx7MnpbEhh9jyipgxe19OcubqV5w
August 1, 2025
104187
Chad
TCD
true
2
1
Public and publicly guaranteed debt service (% of exports of goods, services and primary income)
1995,1994,1993,1992,1991,1990,1989,1988,1987,1986,1985,1984,1983,1978
Download
Bibliothèque de statistiques globales →Chad →

Public and publicly guaranteed debt service (% of exports of goods, services and primary income)

Cette statistique dans les autres pays:

AfghanistanAlbaniaAlgeriaAngolaArgentinaArmeniaAzerbaijanBangladeshBelarusBelizeBeninBhutanBoliviaBosnia and HerzegovinaBotswanaBrazilBulgariaBurkina FasoBurundiCabo VerdeCambodiaCameroonCentral African RepublicChadChinaColombiaComorosCongo, Dem. Rep.Congo, Rep.Costa RicaCote d'IvoireDjiboutiDominicaDominican RepublicEarly-demographic dividendEast Asia & Pacific (excluding high income)East Asia & Pacific (IDA & IBRD countries)EcuadorEgypt, Arab Rep.El SalvadorEritreaEthiopiaEurope & Central Asia (excluding high income)Europe & Central Asia (IDA & IBRD countries)FijiFragile and conflict affected situationsGabonGambia, TheGeorgiaGhanaGrenadaGuatemalaGuineaGuinea-BissauGuyanaHaitiHeavily indebted poor countries (HIPC)HondurasIBRD onlyIDA & IBRD totalIDA blendIDA onlyIDA totalIndiaIndonesiaIran, Islamic Rep.JamaicaJordanKazakhstanKenyaKosovoKyrgyz RepublicLao PDRLate-demographic dividendLatin America & Caribbean Latin America & Caribbean (excluding high income)Latin America & the Caribbean (IDA & IBRD countries)Least developed countries: UN classificationLebanonLesothoLiberiaLow & middle incomeLow incomeLower middle incomeMacedonia, FYRMadagascarMalawiMalaysiaMaldivesMaliMauritaniaMauritiusMexicoMiddle East & North Africa (excluding high income)Middle East & North Africa (IDA & IBRD countries)Middle incomeMoldovaMongoliaMontenegroMoroccoMozambiqueMyanmarNepalNicaraguaNigerNigeriaPacific island small statesPakistanPanamaPapua New GuineaParaguayPeruPhilippinesPre-demographic dividendRomaniaRussian FederationRwandaSamoaSao Tome and PrincipeSenegalSerbiaSierra LeoneSolomon IslandsSouth AfricaSouth AsiaSouth Asia (IDA & IBRD)Sri LankaSt. Kitts and NevisSt. LuciaSt. Vincent and the GrenadinesSub-Saharan Africa Sub-Saharan Africa (excluding high income)Sub-Saharan Africa (IDA & IBRD countries)SudanSwazilandSyrian Arab RepublicTajikistanTanzaniaThailandTogoTongaTunisiaTurkeyUgandaUkraineUpper middle incomeVanuatuVenezuela, RBVietnamYemen, Rep.ZambiaZimbabwe

La ligne de temps

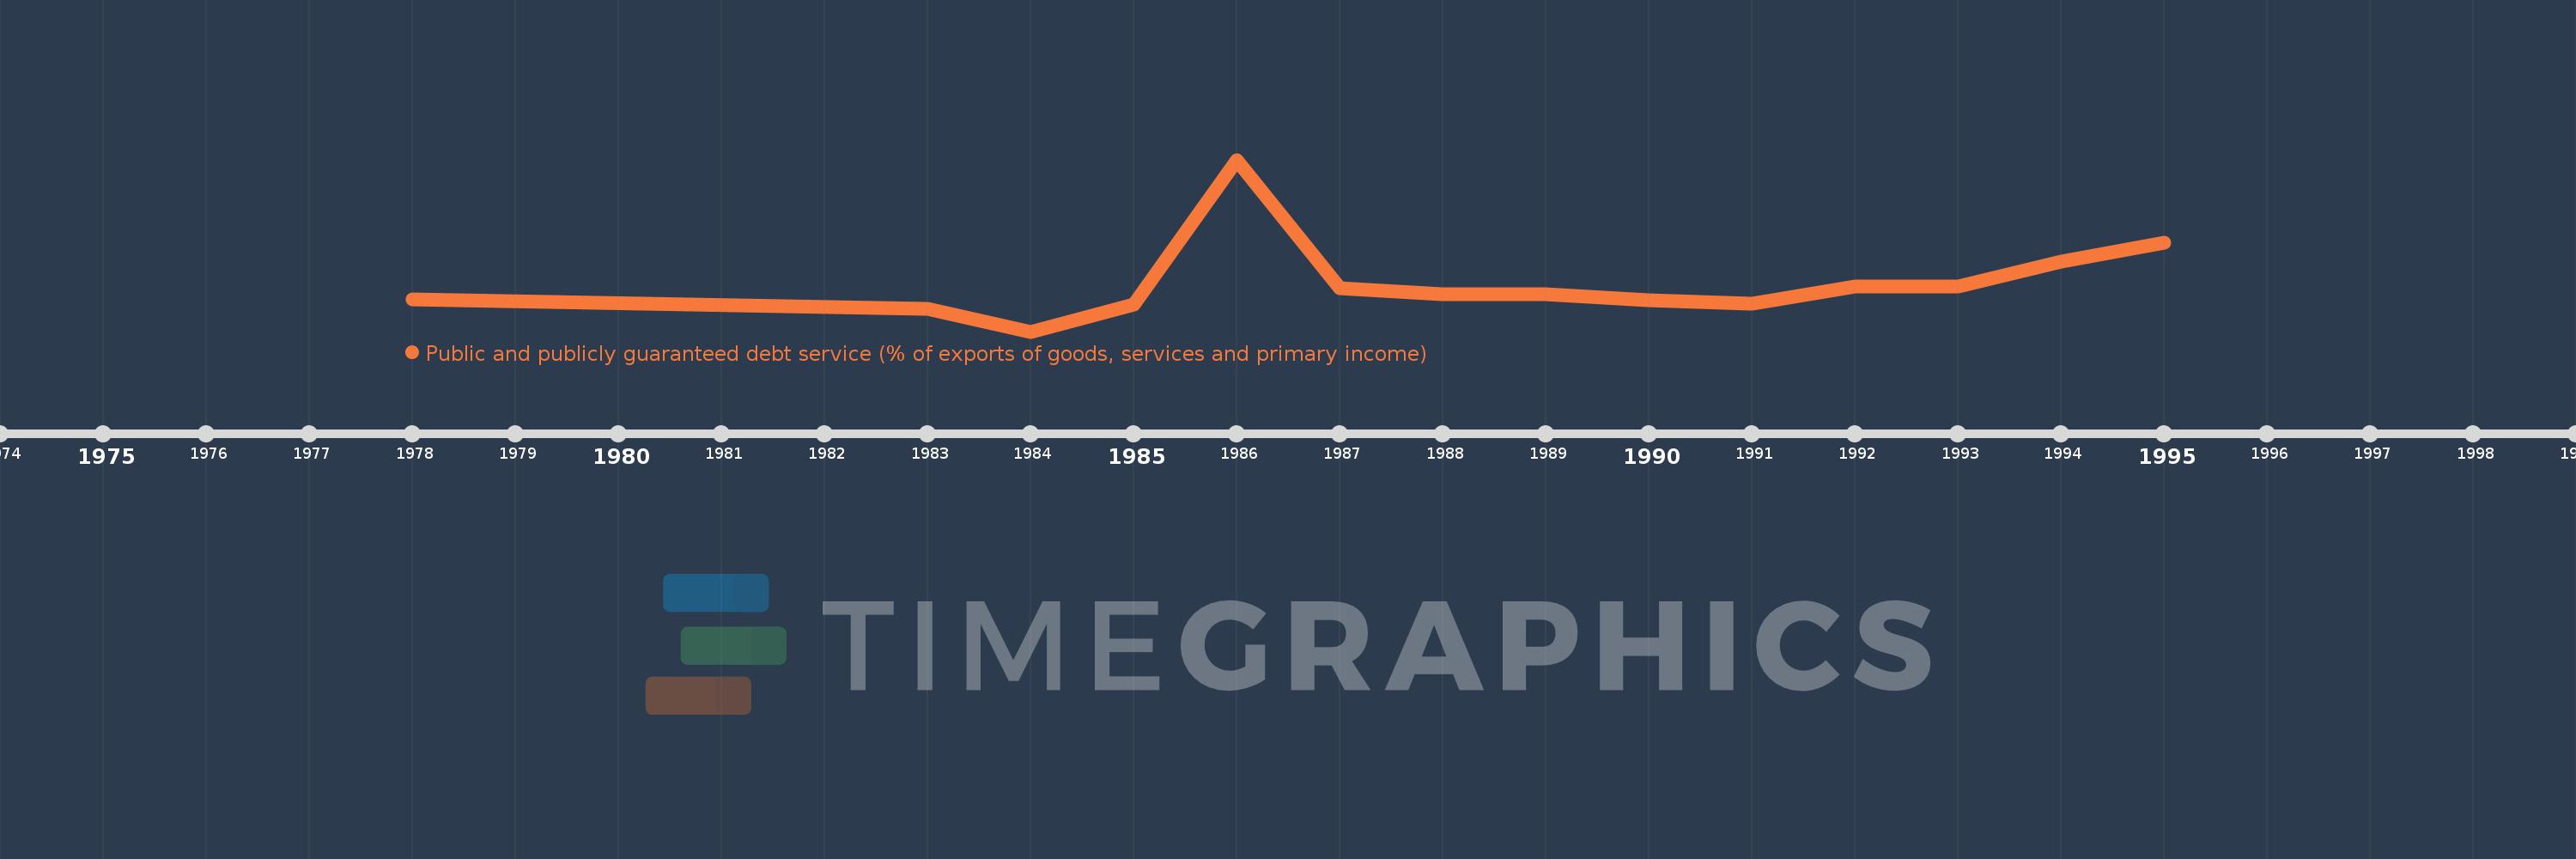
Cette échelle de temps montre un graphique de 1978 année à 1995 année Chad. Les données jusqu'à 1977 année ne sont pas présentés. Quantité d'observations actuelles selon dates: 14.

Source (désignation):

Les indicateurs du développement mondiale

Source (organisation):

World Bank.

Catégories:

External Debt

Dernière mise à jour

23 avr. 2017

Les indicateurs de changement de valeurs selon les années

En moyenne:
3.78
Minimum:
0.335
1 janv. 1984
Maximum:
12.507
1 janv. 1986
Pour la date d''observation
Valeur
Changement absolu
Le changement par rapport à la valeur précédente
1 janv. 1978
2.605
+2.605
0.0%
1 janv. 1983
1.944
-0.661
-25.37%
1 janv. 1984
0.335
-1.609
-82.76%
1 janv. 1985
2.26
+1.925
574.37%
1 janv. 1986
12.507
+10.248
453.48%
1 janv. 1987
3.412
-9.096
-72.72%
1 janv. 1988
3.012
-0.399
-11.71%
1 janv. 1989
2.952
-0.061
-2.01%
1 janv. 1990
2.549
-0.403
-13.65%
1 janv. 1991
2.286
-0.263
-10.33%
1 janv. 1992
3.548
+1.263
55.24%
1 janv. 1993
3.553
+0.005
0.13%
1 janv. 1994
5.297
+1.744
49.09%
1 janv. 1995
6.658
+1.36
25.68%

Classement des pays selon les statistiques actuelles par années