33
/de/
AIzaSyAYiBZKx7MnpbEhh9jyipgxe19OcubqV5w
August 1, 2025
96206
Burundi
BDI
true
2
1
High-technology exports (% of manufactured exports)
2016,2015,2014,2013,2012,2011,2010,2009,2008,2007,2006,2005,2004,2003,2002,2001,2000,1999,1996,1995,1994
Download
Bibliothek der Globalstatistik →Burundi →

High-technology exports (% of manufactured exports)

Diese Statistik in anderen Ländern:

AlbaniaAlgeriaAndorraAntigua and BarbudaArab WorldArgentinaArmeniaArubaAustraliaAustriaAzerbaijanBahamas, TheBahrainBangladeshBarbadosBelarusBelgiumBelizeBeninBermudaBhutanBoliviaBosnia and HerzegovinaBotswanaBrazilBrunei DarussalamBulgariaBurkina FasoBurundiCabo VerdeCambodiaCameroonCanadaCaribbean small statesCentral African RepublicCentral Europe and the BalticsChileChinaColombiaComorosCongo, Rep.Costa RicaCote d'IvoireCroatiaCubaCyprusCzech RepublicDenmarkDjiboutiDominicaDominican RepublicEarly-demographic dividendEast Asia & PacificEast Asia & Pacific (excluding high income)East Asia & Pacific (IDA & IBRD countries)EcuadorEgypt, Arab Rep.El SalvadorEritreaEstoniaEthiopiaEuro areaEurope & Central AsiaEurope & Central Asia (excluding high income)Europe & Central Asia (IDA & IBRD countries)European UnionFaroe IslandsFijiFinlandFragile and conflict affected situationsFranceFrench PolynesiaGabonGambia, TheGeorgiaGermanyGhanaGreeceGreenlandGrenadaGuatemalaGuineaGuinea-BissauGuyanaHaitiHeavily indebted poor countries (HIPC)High incomeHondurasHong Kong SAR, ChinaHungaryIBRD onlyIcelandIDA & IBRD totalIDA blendIDA onlyIDA totalIndiaIndonesiaIran, Islamic Rep.IraqIrelandIsraelItalyJamaicaJapanJordanKazakhstanKenyaKiribatiKorea, Rep.KuwaitKyrgyz RepublicLate-demographic dividendLatin America & Caribbean Latin America & Caribbean (excluding high income)Latin America & the Caribbean (IDA & IBRD countries)LatviaLebanonLesothoLithuaniaLow & middle incomeLow incomeLower middle incomeLuxembourgMacao SAR, ChinaMacedonia, FYRMadagascarMalawiMalaysiaMaldivesMaliMaltaMauritiusMexicoMiddle East & North AfricaMiddle East & North Africa (excluding high income)Middle East & North Africa (IDA & IBRD countries)Middle incomeMoldovaMongoliaMoroccoMozambiqueMyanmarNamibiaNepalNetherlandsNew CaledoniaNew ZealandNicaraguaNigerNigeriaNorth AmericaNorwayOECD membersOmanOther small statesPacific island small statesPakistanPalauPanamaPapua New GuineaParaguayPeruPhilippinesPolandPortugalPost-demographic dividendPre-demographic dividendQatarRomaniaRussian FederationRwandaSamoaSao Tome and PrincipeSaudi ArabiaSenegalSerbiaSeychellesSierra LeoneSingaporeSlovak RepublicSloveniaSmall statesSolomon IslandsSouth AfricaSouth AsiaSouth Asia (IDA & IBRD)SpainSri LankaSt. Kitts and NevisSt. LuciaSt. Vincent and the GrenadinesSub-Saharan Africa Sub-Saharan Africa (excluding high income)Sub-Saharan Africa (IDA & IBRD countries)SudanSurinameSwazilandSwedenSwitzerlandSyrian Arab RepublicTajikistanTanzaniaThailandTimor-LesteTogoTongaTrinidad and TobagoTunisiaTurkeyTurkmenistanTurks and Caicos IslandsTuvaluUgandaUkraineUnited Arab EmiratesUnited KingdomUnited StatesUpper middle incomeUruguayVanuatuVenezuela, RBVietnamWorldYemen, Rep.ZambiaZimbabwe

Zeitlinie:

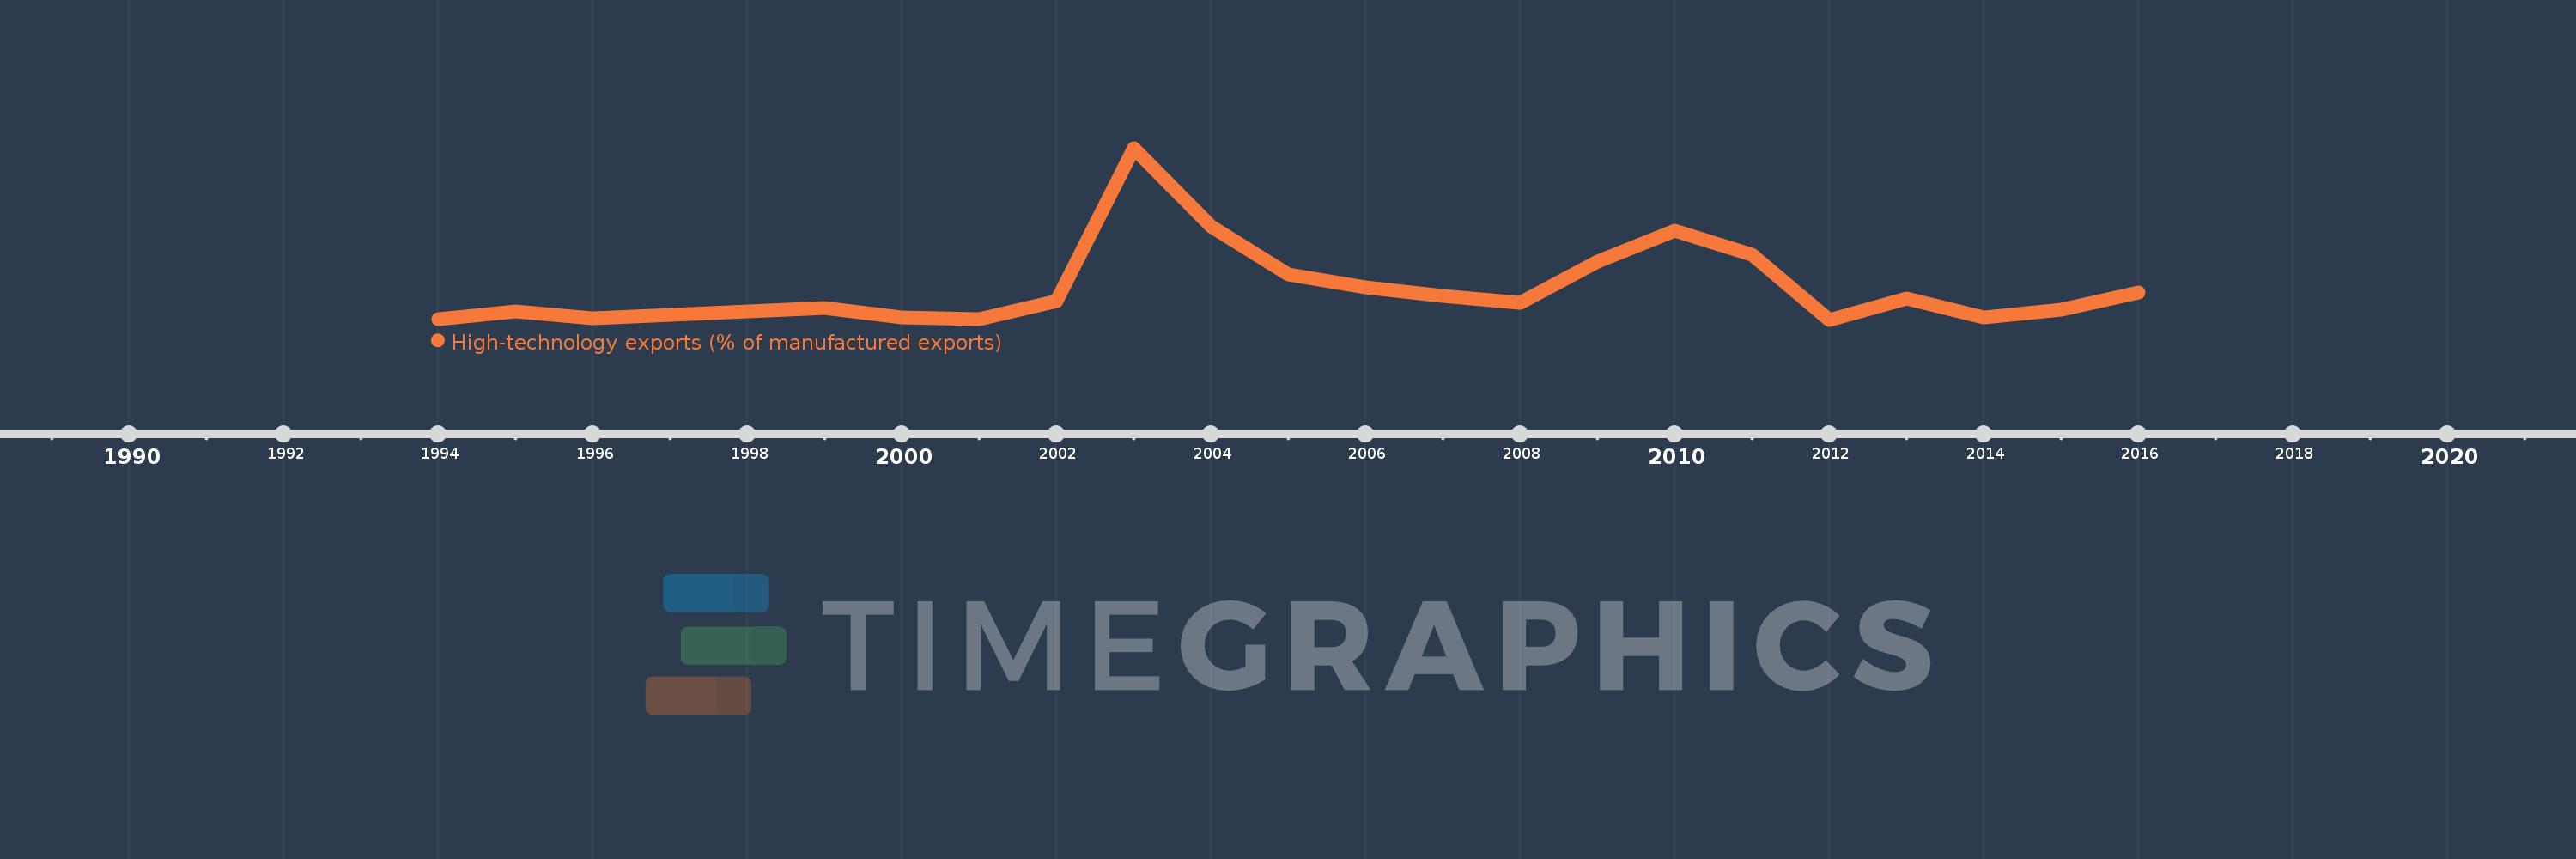
Diese Zeitleiste vorliegt die Graphik ab 1994 J. bis 2016 J. Burundi. Die Angaben bis 1993 J. sind nicht vorhanden. Die Zahl aktueller Beobachtungen nach Daten: 21.

Die Quelle (Bezeichnung):

Kennzahlen der Weltentwicklung

Die Quelle (Einrichtung):

United Nations, Comtrade database.

Kategorien:

Private Sector, Science & Technology, Trade

Es wurde aktualisiert:

23 Apr 2017 Jahr

Kennzahlen der Wertänderungen vom Jahr zum Jahr

im Durchschnitt:
4.32
Minimum:
0.0
1 Jan 2012 Jahr
Maximum:
22.344
1 Jan 2003 Jahr
Zum Datum der Beobachtung
Wert
Absolute Veränderung
Die Veränderung bezüglich dem vorherigen Wert
1 Jan 1994 Jahr
0.041
+0.041
0.0%
1 Jan 1995 Jahr
1.063
+1.023
2.52 Tsnd.%
1 Jan 1996 Jahr
0.197
-0.867
-81.49%
1 Jan 1999 Jahr
1.489
+1.292
656.12%
1 Jan 2000 Jahr
0.332
-1.157
-77.7%
1 Jan 2001 Jahr
0.029
-0.303
-91.15%
1 Jan 2002 Jahr
2.413
+2.384
8.11 Tsnd.%
1 Jan 2003 Jahr
22.344
+19.93
825.9%
1 Jan 2004 Jahr
12.089
-10.255
-45.9%
1 Jan 2005 Jahr
5.874
-6.214
-51.41%
1 Jan 2006 Jahr
4.193
-1.681
-28.62%
1 Jan 2007 Jahr
3.138
-1.055
-25.15%
1 Jan 2008 Jahr
2.165
-0.974
-31.02%
1 Jan 2009 Jahr
7.515
+5.35
247.16%
1 Jan 2010 Jahr
11.537
+4.022
53.52%
1 Jan 2011 Jahr
8.496
-3.041
-26.36%
1 Jan 2012 Jahr
0.0
-8.495
-100.0%
1 Jan 2013 Jahr
2.747
+2.747
1.11 Mln.%
1 Jan 2014 Jahr
0.285
-2.463
-89.64%
1 Jan 2015 Jahr
1.283
+0.999
350.81%
1 Jan 2016 Jahr
3.492
+2.208
172.05%

Bewertung der Länder gemäß mit laufender Statistik nach Jahren