29
/de/
de
AIzaSyAYiBZKx7MnpbEhh9jyipgxe19OcubqV5w
April 1, 2024
95473
Burkina Faso
BFA
true
2
1
Progression to secondary school, female (%)
2014,2013,2012,2010,2009,2008,2007,2006,2005,2003,2001,2000,1999,1995,1981,1980,1978,1977,1976,1975,1974,1973,1972
Download
Bibliothek der Globalstatistik →Burkina Faso →

Progression to secondary school, female (%)

Diese Statistik in anderen Ländern:
AfghanistanAlbaniaAlgeriaAngolaAntigua and BarbudaArab WorldArgentinaArmeniaArubaAustriaAzerbaijanBahamas, TheBahrainBarbadosBelarusBelgiumBelizeBeninBermudaBhutanBoliviaBosnia and HerzegovinaBotswanaBrazilBritish Virgin IslandsBrunei DarussalamBulgariaBurkina FasoBurundiCabo VerdeCambodiaCameroonCaribbean small statesCayman IslandsCentral African RepublicCentral Europe and the BalticsChadChileChinaColombiaComorosCongo, Dem. Rep.Congo, Rep.Costa RicaCote d'IvoireCroatiaCubaCyprusCzech RepublicDenmarkDjiboutiDominicaDominican RepublicEarly-demographic dividendEast Asia & PacificEast Asia & Pacific (excluding high income)East Asia & Pacific (IDA & IBRD countries)EcuadorEgypt, Arab Rep.El SalvadorEquatorial GuineaEritreaEstoniaEthiopiaEuro areaEurope & Central AsiaEurope & Central Asia (excluding high income)Europe & Central Asia (IDA & IBRD countries)European UnionFijiFinlandFragile and conflict affected situationsGabonGambia, TheGeorgiaGermanyGhanaGreeceGrenadaGuatemalaGuineaGuinea-BissauGuyanaHaitiHeavily indebted poor countries (HIPC)High incomeHondurasHong Kong SAR, ChinaHungaryIBRD onlyIcelandIDA & IBRD totalIDA blendIDA onlyIDA totalIndiaIndonesiaIran, Islamic Rep.IraqIsraelItalyJamaicaJapanJordanKazakhstanKenyaKiribatiKorea, Rep.KuwaitKyrgyz RepublicLao PDRLate-demographic dividendLatin America & Caribbean Latin America & Caribbean (excluding high income)Latin America & the Caribbean (IDA & IBRD countries)LatviaLeast developed countries: UN classificationLebanonLesothoLiberiaLibyaLiechtensteinLithuaniaLow & middle incomeLow incomeLower middle incomeLuxembourgMacao SAR, ChinaMacedonia, FYRMadagascarMalawiMalaysiaMaldivesMaliMaltaMarshall IslandsMauritaniaMauritiusMexicoMiddle East & North AfricaMiddle East & North Africa (excluding high income)Middle East & North Africa (IDA & IBRD countries)Middle incomeMoldovaMonacoMongoliaMoroccoMozambiqueMyanmarNamibiaNepalNetherlandsNicaraguaNigerNorwayOECD membersOmanOther small statesPacific island small statesPakistanPalauPanamaParaguayPeruPhilippinesPolandPortugalPost-demographic dividendPre-demographic dividendQatarRomaniaRussian FederationRwandaSamoaSan MarinoSao Tome and PrincipeSaudi ArabiaSenegalSerbiaSeychellesSierra LeoneSingaporeSlovak RepublicSloveniaSmall statesSolomon IslandsSouth AfricaSouth AsiaSouth Asia (IDA & IBRD)SpainSri LankaSt. Kitts and NevisSt. LuciaSt. Vincent and the GrenadinesSub-Saharan Africa Sub-Saharan Africa (excluding high income)Sub-Saharan Africa (IDA & IBRD countries)SudanSurinameSwazilandSwedenSwitzerlandSyrian Arab RepublicTajikistanTanzaniaThailandTimor-LesteTogoTongaTrinidad and TobagoTunisiaTurkeyTurks and Caicos IslandsTuvaluUgandaUkraineUnited Arab EmiratesUpper middle incomeUruguayUzbekistanVanuatuVenezuela, RBVietnamWest Bank and GazaWorldYemen, Rep.ZambiaZimbabwe
Zeitlinie:
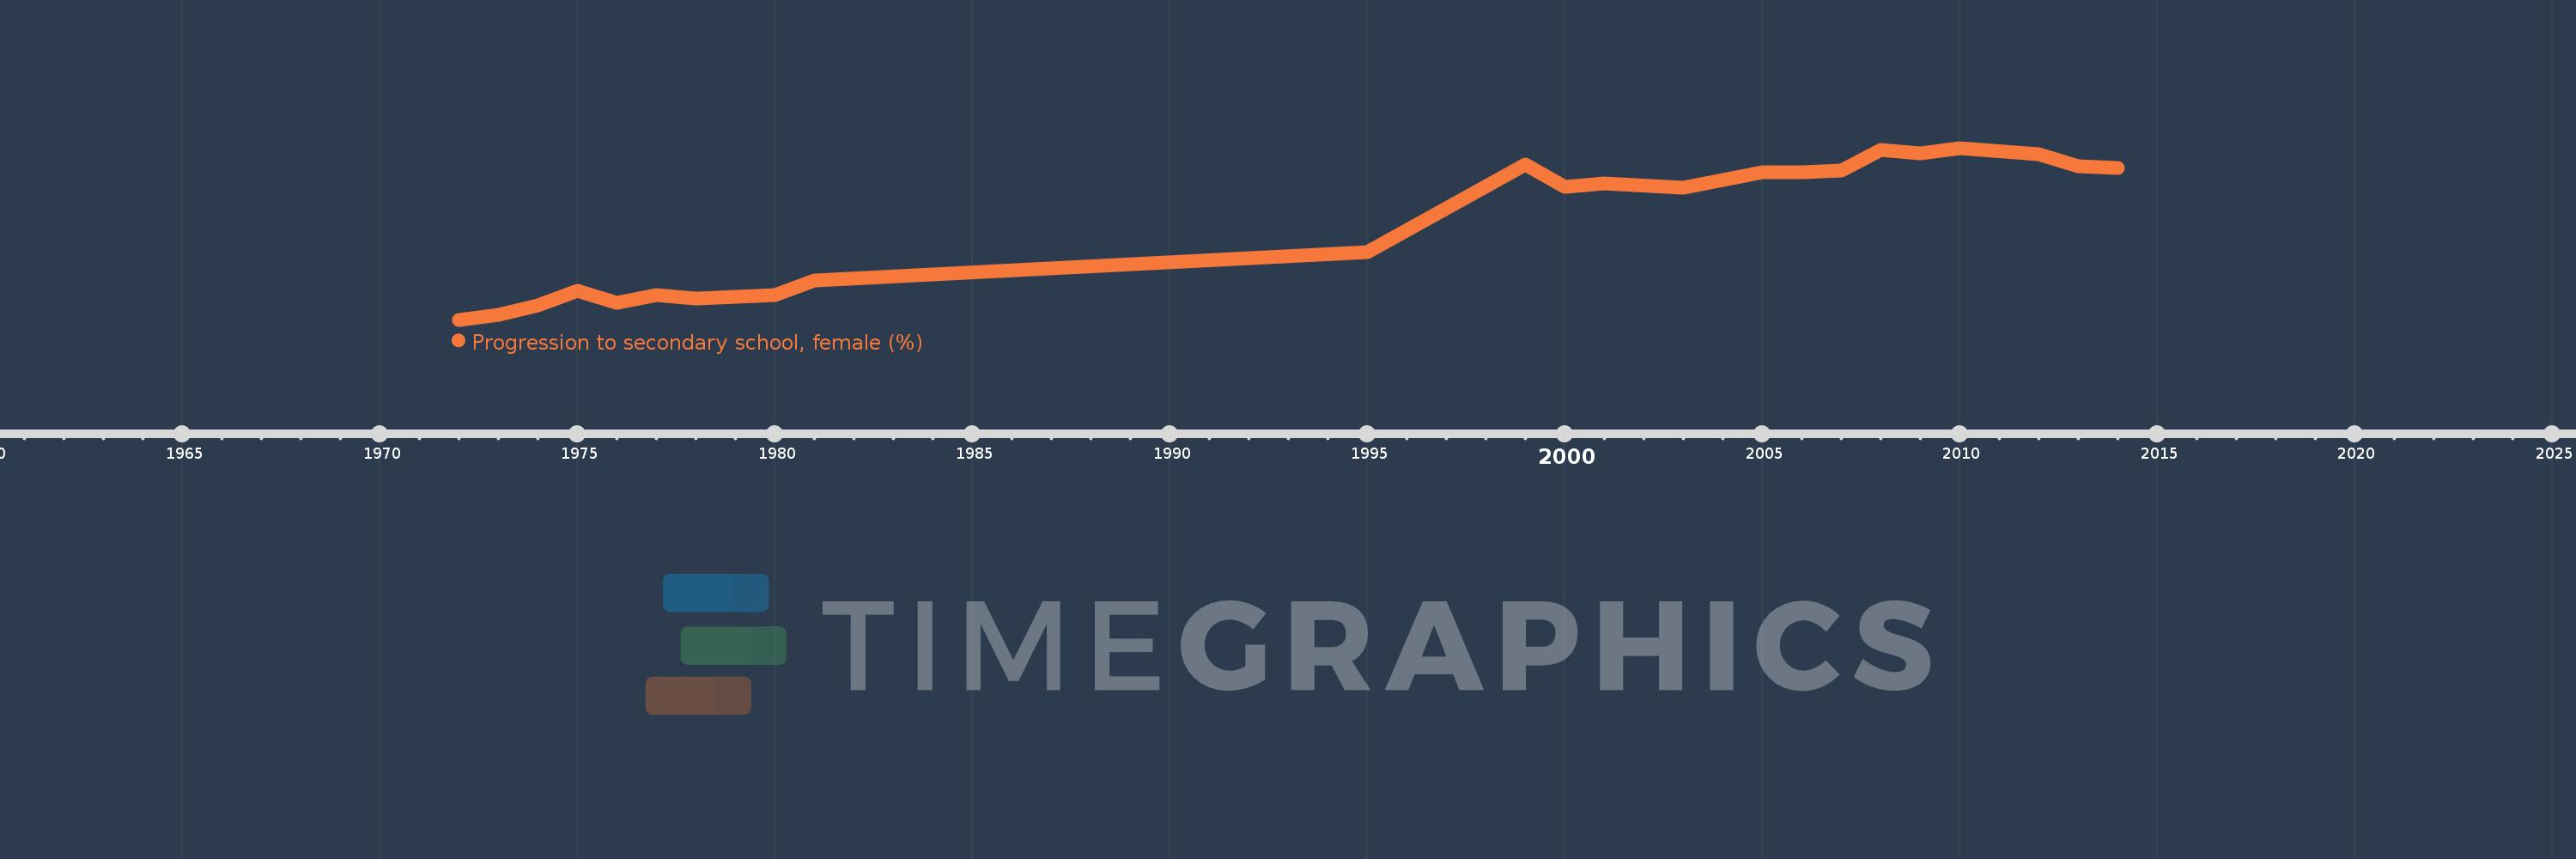
Diese Zeitleiste vorliegt die Graphik ab 1972 J. bis 2014 J. Burkina Faso. Die Angaben bis 1971 J. sind nicht vorhanden. Die Zahl aktueller Beobachtungen nach Daten: 23.
Die Quelle (Bezeichnung):
Kennzahlen der Weltentwicklung
Die Quelle (Einrichtung):
United Nations Educational, Scientific, and Cultural Organization (UNESCO) Institute for Statistics.
Kategorien:
Education, Gender
Es wurde aktualisiert:
23 Apr 2017 Jahr
Kennzahlen der Wertänderungen vom Jahr zum Jahr
im Durchschnitt:
48.625
Minimum:
16.941
1 Jan 1972 Jahr
Maximum:
73.356
1 Jan 2010 Jahr
Zum Datum der Beobachtung
Wert
Absolute Veränderung
Die Veränderung bezüglich dem vorherigen Wert
1 Jan 1972 Jahr
16.941
+16.941
0.0%
1 Jan 1973 Jahr
18.635
+1.694
10.0%
1 Jan 1974 Jahr
21.6
+2.965
15.91%
1 Jan 1975 Jahr
26.337
+4.737
21.93%
1 Jan 1976 Jahr
22.412
-3.925
-14.9%
1 Jan 1977 Jahr
24.932
+2.52
11.24%
1 Jan 1978 Jahr
23.842
-1.089
-4.37%
1 Jan 1980 Jahr
24.986
+1.144
4.8%
1 Jan 1981 Jahr
29.755
+4.769
19.09%
1 Jan 1995 Jahr
39.132
+9.377
31.51%
1 Jan 1999 Jahr
67.862
+28.73
73.42%
1 Jan 2000 Jahr
60.491
-7.371
-10.86%
1 Jan 2001 Jahr
61.587
+1.096
1.81%
1 Jan 2003 Jahr
60.219
-1.368
-2.22%
1 Jan 2005 Jahr
65.299
+5.08
8.44%
1 Jan 2006 Jahr
65.242
-0.057
-0.09%
1 Jan 2007 Jahr
66.034
+0.793
1.21%
1 Jan 2008 Jahr
72.823
+6.789
10.28%
1 Jan 2009 Jahr
71.696
-1.128
-1.55%
1 Jan 2010 Jahr
73.356
+1.661
2.32%
1 Jan 2012 Jahr
71.165
-2.191
-2.99%
1 Jan 2013 Jahr
67.287
-3.878
-5.45%
1 Jan 2014 Jahr
66.745
-0.541
-0.8%
Bewertung der Länder gemäß mit laufender Statistik nach Jahren

Kommentare:

Abschicken
PremiumAbout & FeedbackVereinbarungPrivatheit
logo
© 2022 Selected Technologies LLC – Morgan Hill, California