Download Diese Statistik in anderen Ländern:
Zeitlinie:
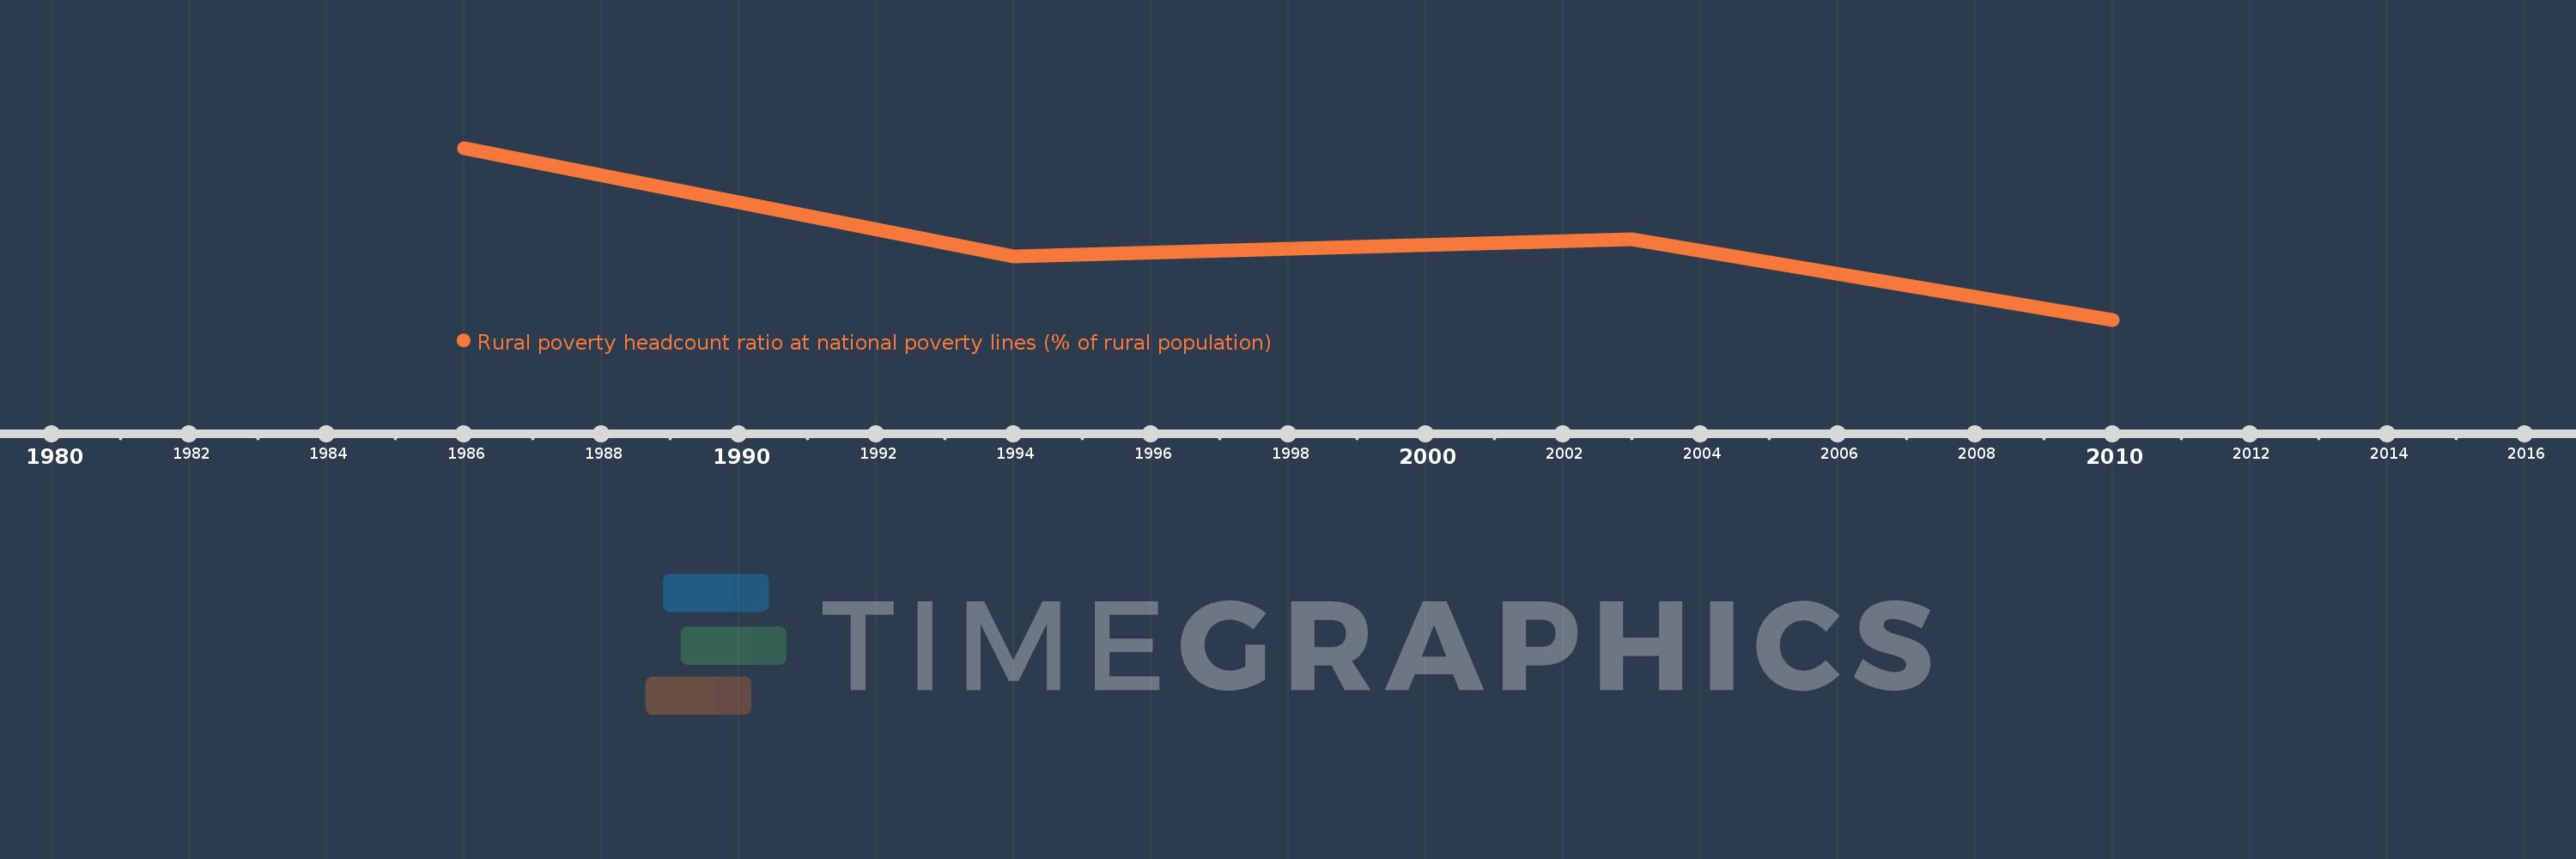
Diese Zeitleiste vorliegt die Graphik ab 1986 J. bis 2010 J. Botswana. Die Angaben bis 1985 J. sind nicht vorhanden. Die Zahl aktueller Beobachtungen nach Daten: 4.
Die Quelle (Bezeichnung):
Kennzahlen der Weltentwicklung
Die Quelle (Einrichtung):
World Bank, Global Poverty Working Group. Data are compiled from official government sources or are computed by World Bank staff using national (i.e. country–specific) poverty lines.
Kategorien:
Agriculture & Rural Development, Poverty
Es wurde aktualisiert:
23 Apr 2017 Jahr
Kennzahlen der Wertänderungen vom Jahr zum Jahr
Minimum:
24.3
1 Jan 2010 Jahr
Maximum:
68.0
1 Jan 1986 Jahr
Zum Datum der Beobachtung
Wert
Absolute Veränderung
Die Veränderung bezüglich dem vorherigen Wert
1 Jan 1986 Jahr
68.0
+68.0
0.0%
1 Jan 1994 Jahr
40.4
-27.6
-40.59%
1 Jan 2003 Jahr
44.8
+4.4
10.89%
1 Jan 2010 Jahr
24.3
-20.5
-45.76%
Bewertung der Länder gemäß mit laufender Statistik nach Jahren