29
/de/
de
AIzaSyAYiBZKx7MnpbEhh9jyipgxe19OcubqV5w
April 1, 2024
88289
Bosnia and Herzegovina
BIH
true
2
1
CO2 emissions (kt)
2014,2013,2012,2011,2010,2009,2008,2007,2006,2005,2004,2003,2002,2001,2000,1999,1998,1997,1996,1995,1994,1993
Download
Bibliothek der Globalstatistik →Bosnia and Herzegovina →

CO2 emissions (kt)

Diese Statistik in anderen Ländern:
AfghanistanAlbaniaAlgeriaAndorraAngolaAntigua and BarbudaArab WorldArgentinaArmeniaArubaAustraliaAustriaAzerbaijanBahamas, TheBahrainBangladeshBarbadosBelarusBelgiumBelizeBeninBermudaBhutanBoliviaBosnia and HerzegovinaBotswanaBrazilBritish Virgin IslandsBrunei DarussalamBulgariaBurkina FasoBurundiCabo VerdeCambodiaCameroonCanadaCaribbean small statesCayman IslandsCentral African RepublicCentral Europe and the BalticsChadChileChinaColombiaComorosCongo, Dem. Rep.Congo, Rep.Costa RicaCote d'IvoireCroatiaCubaCuracaoCyprusCzech RepublicDenmarkDjiboutiDominicaDominican RepublicEarly-demographic dividendEast Asia & PacificEast Asia & Pacific (excluding high income)East Asia & Pacific (IDA & IBRD countries)EcuadorEgypt, Arab Rep.El SalvadorEquatorial GuineaEritreaEstoniaEthiopiaEuro areaEurope & Central AsiaEurope & Central Asia (excluding high income)Europe & Central Asia (IDA & IBRD countries)European UnionFaroe IslandsFijiFinlandFragile and conflict affected situationsFranceFrench PolynesiaGabonGambia, TheGeorgiaGermanyGhanaGibraltarGreeceGreenlandGrenadaGuatemalaGuineaGuinea-BissauGuyanaHaitiHeavily indebted poor countries (HIPC)High incomeHondurasHong Kong SAR, ChinaHungaryIBRD onlyIcelandIDA & IBRD totalIDA blendIDA onlyIDA totalIndiaIndonesiaIran, Islamic Rep.IraqIrelandIsraelItalyJamaicaJapanJordanKazakhstanKenyaKiribatiKorea, Dem. People’s Rep.Korea, Rep.KuwaitKyrgyz RepublicLao PDRLate-demographic dividendLatin America & Caribbean Latin America & Caribbean (excluding high income)Latin America & the Caribbean (IDA & IBRD countries)LatviaLeast developed countries: UN classificationLebanonLesothoLiberiaLibyaLiechtensteinLithuaniaLow & middle incomeLow incomeLower middle incomeLuxembourgMacao SAR, ChinaMacedonia, FYRMadagascarMalawiMalaysiaMaldivesMaliMaltaMarshall IslandsMauritaniaMauritiusMexicoMicronesia, Fed. Sts.Middle East & North AfricaMiddle East & North Africa (excluding high income)Middle East & North Africa (IDA & IBRD countries)Middle incomeMoldovaMongoliaMontenegroMoroccoMozambiqueMyanmarNamibiaNauruNepalNetherlandsNew CaledoniaNew ZealandNicaraguaNigerNigeriaNorth AmericaNorwayOECD membersOmanOther small statesPacific island small statesPakistanPalauPanamaPapua New GuineaParaguayPeruPhilippinesPolandPortugalPost-demographic dividendPre-demographic dividendQatarRomaniaRussian FederationRwandaSamoaSao Tome and PrincipeSaudi ArabiaSenegalSerbiaSeychellesSierra LeoneSingaporeSint Maarten (Dutch part)Slovak RepublicSloveniaSmall statesSolomon IslandsSomaliaSouth AfricaSouth AsiaSouth Asia (IDA & IBRD)South SudanSpainSri LankaSt. Kitts and NevisSt. LuciaSt. Vincent and the GrenadinesSub-Saharan Africa Sub-Saharan Africa (excluding high income)Sub-Saharan Africa (IDA & IBRD countries)SudanSurinameSwazilandSwedenSwitzerlandSyrian Arab RepublicTajikistanTanzaniaThailandTimor-LesteTogoTongaTrinidad and TobagoTunisiaTurkeyTurkmenistanTurks and Caicos IslandsUgandaUkraineUnited Arab EmiratesUnited KingdomUnited StatesUpper middle incomeUruguayUzbekistanVanuatuVenezuela, RBVietnamWest Bank and GazaWorldYemen, Rep.ZambiaZimbabwe
Zeitlinie:
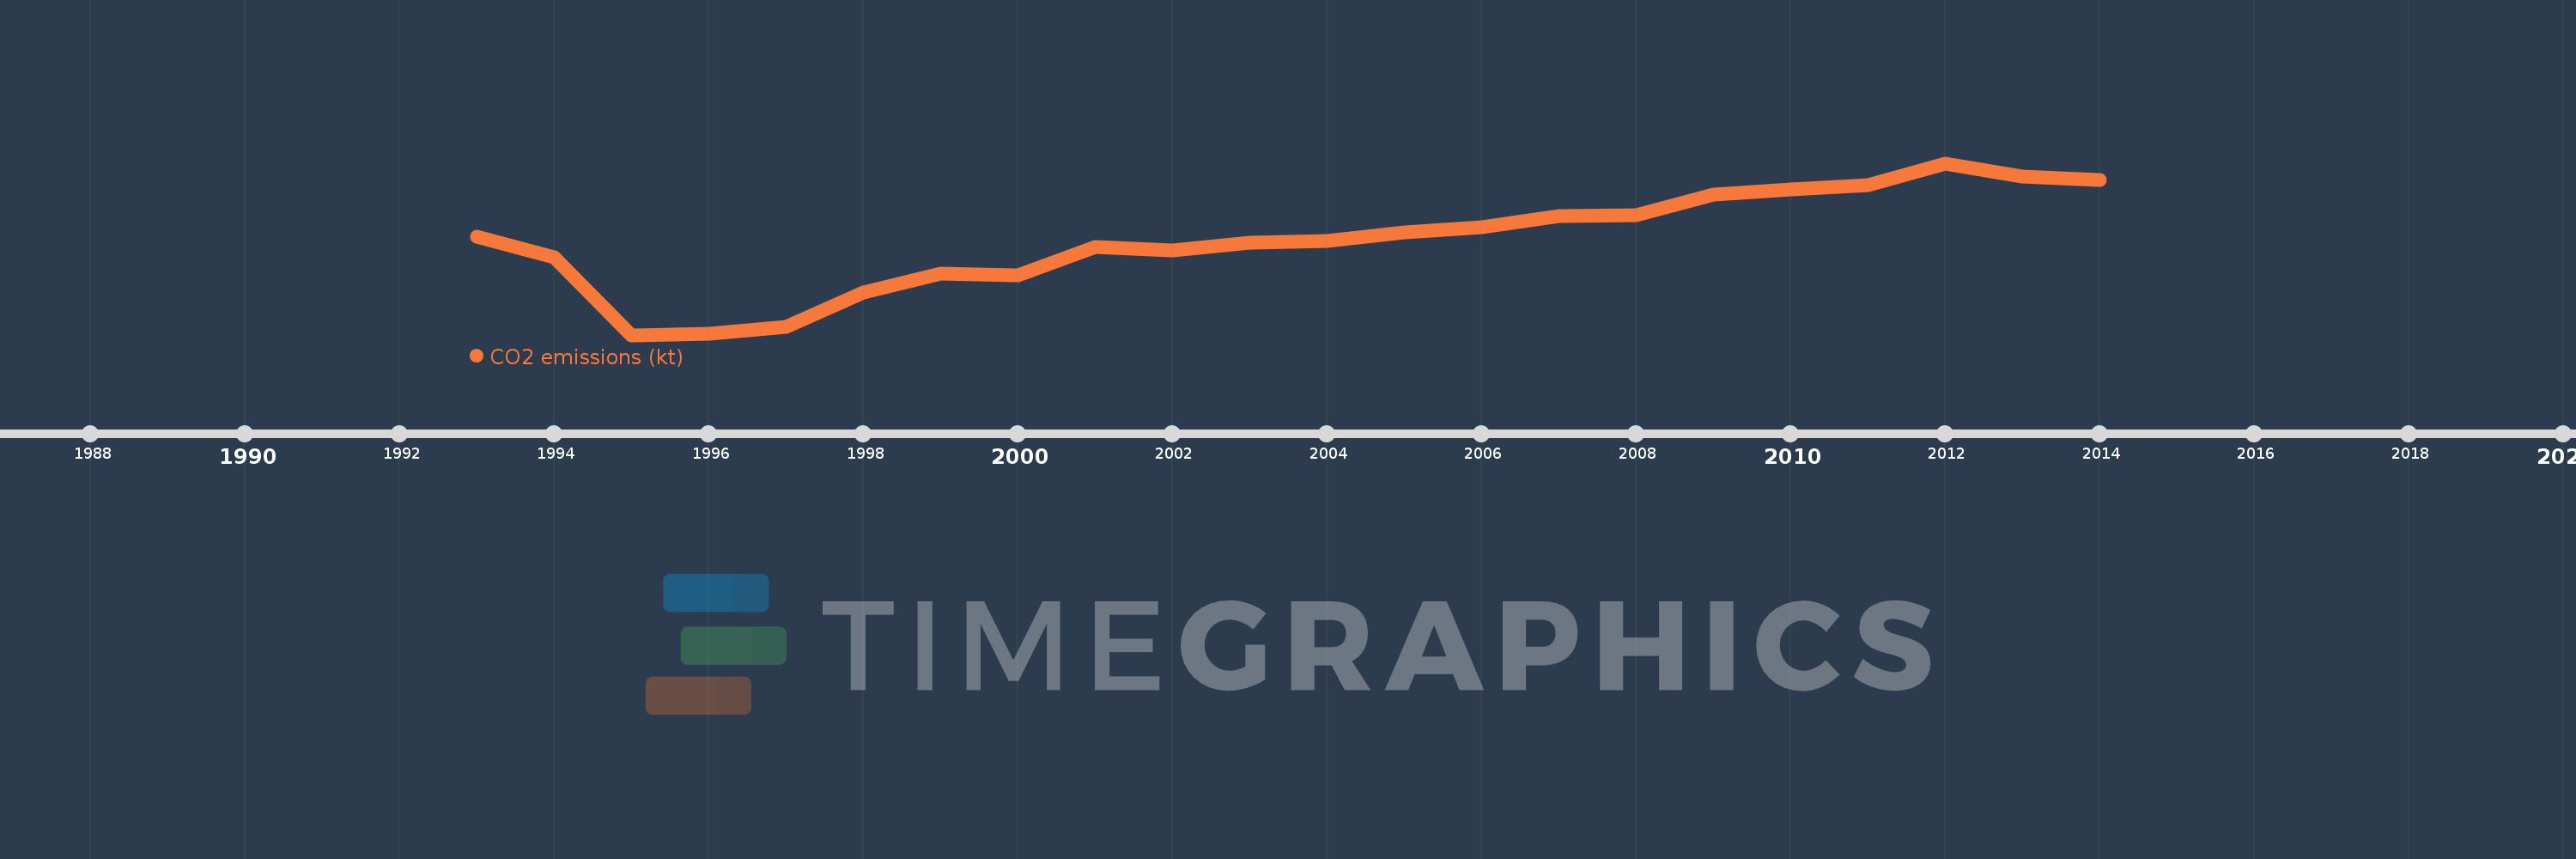
Diese Zeitleiste vorliegt die Graphik ab 1993 J. bis 2014 J. Bosnia and Herzegovina. Die Angaben bis 1992 J. sind nicht vorhanden. Die Zahl aktueller Beobachtungen nach Daten: 22.
Die Quelle (Bezeichnung):
Kennzahlen der Weltentwicklung
Die Quelle (Einrichtung):
Carbon Dioxide Information Analysis Center, Environmental Sciences Division, Oak Ridge National Laboratory, Tennessee, United States.
Kategorien:
Climate Change, Environment
Es wurde aktualisiert:
23 Apr 2017 Jahr
Kennzahlen der Wertänderungen vom Jahr zum Jahr
im Durchschnitt:
14.595 Tsnd.
Minimum:
3.231 Tsnd.
1 Jan 1995 Jahr
Maximum:
23.887 Tsnd.
1 Jan 2012 Jahr
Zum Datum der Beobachtung
Wert
Absolute Veränderung
Die Veränderung bezüglich dem vorherigen Wert
1 Jan 1993 Jahr
15.053 Tsnd.
+15.053 Tsnd.
0.0%
1 Jan 1994 Jahr
12.603 Tsnd.
-2.45 Tsnd.
-16.27%
1 Jan 1995 Jahr
3.231 Tsnd.
-9.373 Tsnd.
-74.37%
1 Jan 1996 Jahr
3.429 Tsnd.
+198.018
6.13%
1 Jan 1997 Jahr
4.257 Tsnd.
+828.742
24.17%
1 Jan 1998 Jahr
8.394 Tsnd.
+4.136 Tsnd.
97.16%
1 Jan 1999 Jahr
10.594 Tsnd.
+2.2 Tsnd.
26.21%
1 Jan 2000 Jahr
10.378 Tsnd.
-216.353
-2.04%
1 Jan 2001 Jahr
13.788 Tsnd.
+3.41 Tsnd.
32.86%
1 Jan 2002 Jahr
13.363 Tsnd.
-425.372
-3.09%
1 Jan 2003 Jahr
14.301 Tsnd.
+938.752
7.03%
1 Jan 2004 Jahr
14.488 Tsnd.
+187.017
1.31%
1 Jan 2005 Jahr
15.61 Tsnd.
+1.122 Tsnd.
7.74%
1 Jan 2006 Jahr
16.204 Tsnd.
+594.054
3.81%
1 Jan 2007 Jahr
17.565 Tsnd.
+1.36 Tsnd.
8.4%
1 Jan 2008 Jahr
17.653 Tsnd.
+88.008
0.5%
1 Jan 2009 Jahr
20.154 Tsnd.
+2.501 Tsnd.
14.17%
1 Jan 2010 Jahr
20.704 Tsnd.
+550.05
2.73%
1 Jan 2011 Jahr
21.276 Tsnd.
+572.052
2.76%
1 Jan 2012 Jahr
23.887 Tsnd.
+2.611 Tsnd.
12.27%
1 Jan 2013 Jahr
22.259 Tsnd.
-1.628 Tsnd.
-6.82%
1 Jan 2014 Jahr
21.907 Tsnd.
-352.032
-1.58%
Bewertung der Länder gemäß mit laufender Statistik nach Jahren

Kommentare:

Abschicken
PremiumAbout & FeedbackVereinbarungPrivatheit
logo
© 2022 Selected Technologies LLC – Morgan Hill, California