33
/de/
AIzaSyB4mHJ5NPEv-XzF7P6NDYXjlkCWaeKw5bc
November 1, 2025
85331
Bermuda
BMU
true
2
1
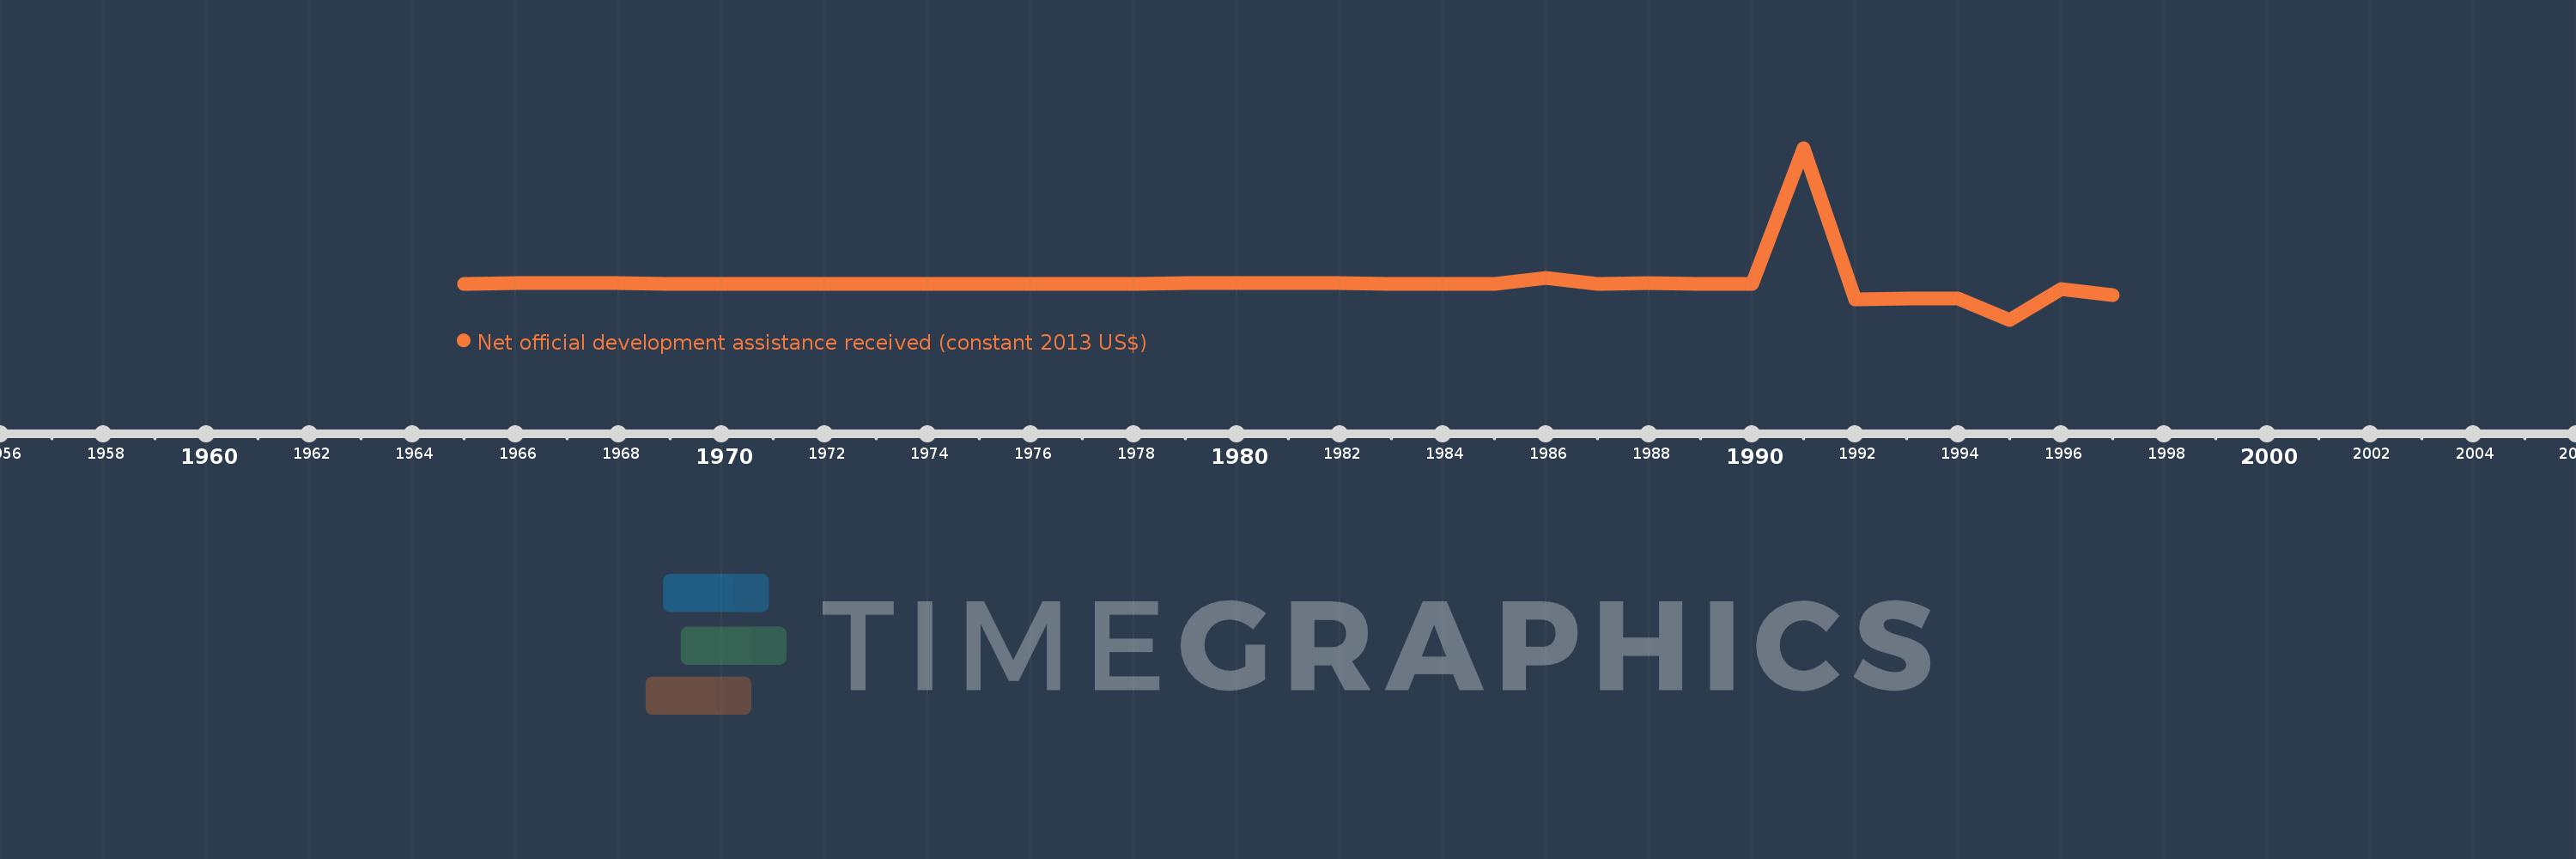
Net official development assistance received (constant 2013 US$)
1997,1996,1995,1994,1993,1992,1991,1990,1989,1988,1987,1986,1985,1984,1983,1982,1981,1980,1979,1978,1977,1976,1975,1973,1971,1970,1969,1968,1967,1966,1965