33
/de/
AIzaSyAYiBZKx7MnpbEhh9jyipgxe19OcubqV5w
August 1, 2025
81341
Belarus
BLR
true
2
1
Total reserves (% of total external debt)
2016,2015,2014,2013,2012,2011,2010,2009,2008,2007,2006,2005,2004,2003,2002,2001,2000,1999,1998,1997,1996,1995
Download
Bibliothek der Globalstatistik →Belarus →

Total reserves (% of total external debt)

Diese Statistik in anderen Ländern:

AfghanistanAlbaniaAlgeriaAngolaArab WorldArgentinaArmeniaAzerbaijanBangladeshBelarusBelizeBeninBhutanBoliviaBosnia and HerzegovinaBotswanaBrazilBulgariaBurkina FasoBurundiCabo VerdeCambodiaCameroonCaribbean small statesCentral African RepublicCentral Europe and the BalticsChadChinaColombiaComorosCongo, Dem. Rep.Congo, Rep.Costa RicaCote d'IvoireDjiboutiDominicaDominican RepublicEarly-demographic dividendEast Asia & PacificEast Asia & Pacific (excluding high income)East Asia & Pacific (IDA & IBRD countries)EcuadorEgypt, Arab Rep.El SalvadorEritreaEthiopiaEurope & Central AsiaEurope & Central Asia (excluding high income)Europe & Central Asia (IDA & IBRD countries)FijiFragile and conflict affected situationsGabonGambia, TheGeorgiaGhanaGrenadaGuatemalaGuineaGuinea-BissauGuyanaHaitiHeavily indebted poor countries (HIPC)HondurasIBRD onlyIDA & IBRD totalIDA blendIDA onlyIDA totalIndiaIndonesiaIran, Islamic Rep.JamaicaJordanKazakhstanKenyaKosovoKyrgyz RepublicLao PDRLate-demographic dividendLatin America & Caribbean Latin America & Caribbean (excluding high income)Latin America & the Caribbean (IDA & IBRD countries)Least developed countries: UN classificationLebanonLesothoLiberiaLow & middle incomeLow incomeLower middle incomeMacedonia, FYRMadagascarMalawiMalaysiaMaldivesMaliMauritaniaMauritiusMexicoMiddle East & North AfricaMiddle East & North Africa (excluding high income)Middle East & North Africa (IDA & IBRD countries)Middle incomeMoldovaMongoliaMontenegroMoroccoMozambiqueMyanmarNepalNicaraguaNigerNigeriaOther small statesPacific island small statesPakistanPanamaPapua New GuineaParaguayPeruPhilippinesPre-demographic dividendRomaniaRussian FederationRwandaSamoaSao Tome and PrincipeSenegalSerbiaSierra LeoneSmall statesSolomon IslandsSouth AfricaSouth AsiaSouth Asia (IDA & IBRD)Sri LankaSt. LuciaSt. Vincent and the GrenadinesSub-Saharan Africa Sub-Saharan Africa (excluding high income)Sub-Saharan Africa (IDA & IBRD countries)SudanSwazilandSyrian Arab RepublicTajikistanTanzaniaThailandTogoTongaTunisiaTurkeyUgandaUkraineUpper middle incomeVanuatuVenezuela, RBVietnamYemen, Rep.ZambiaZimbabwe

Zeitlinie:

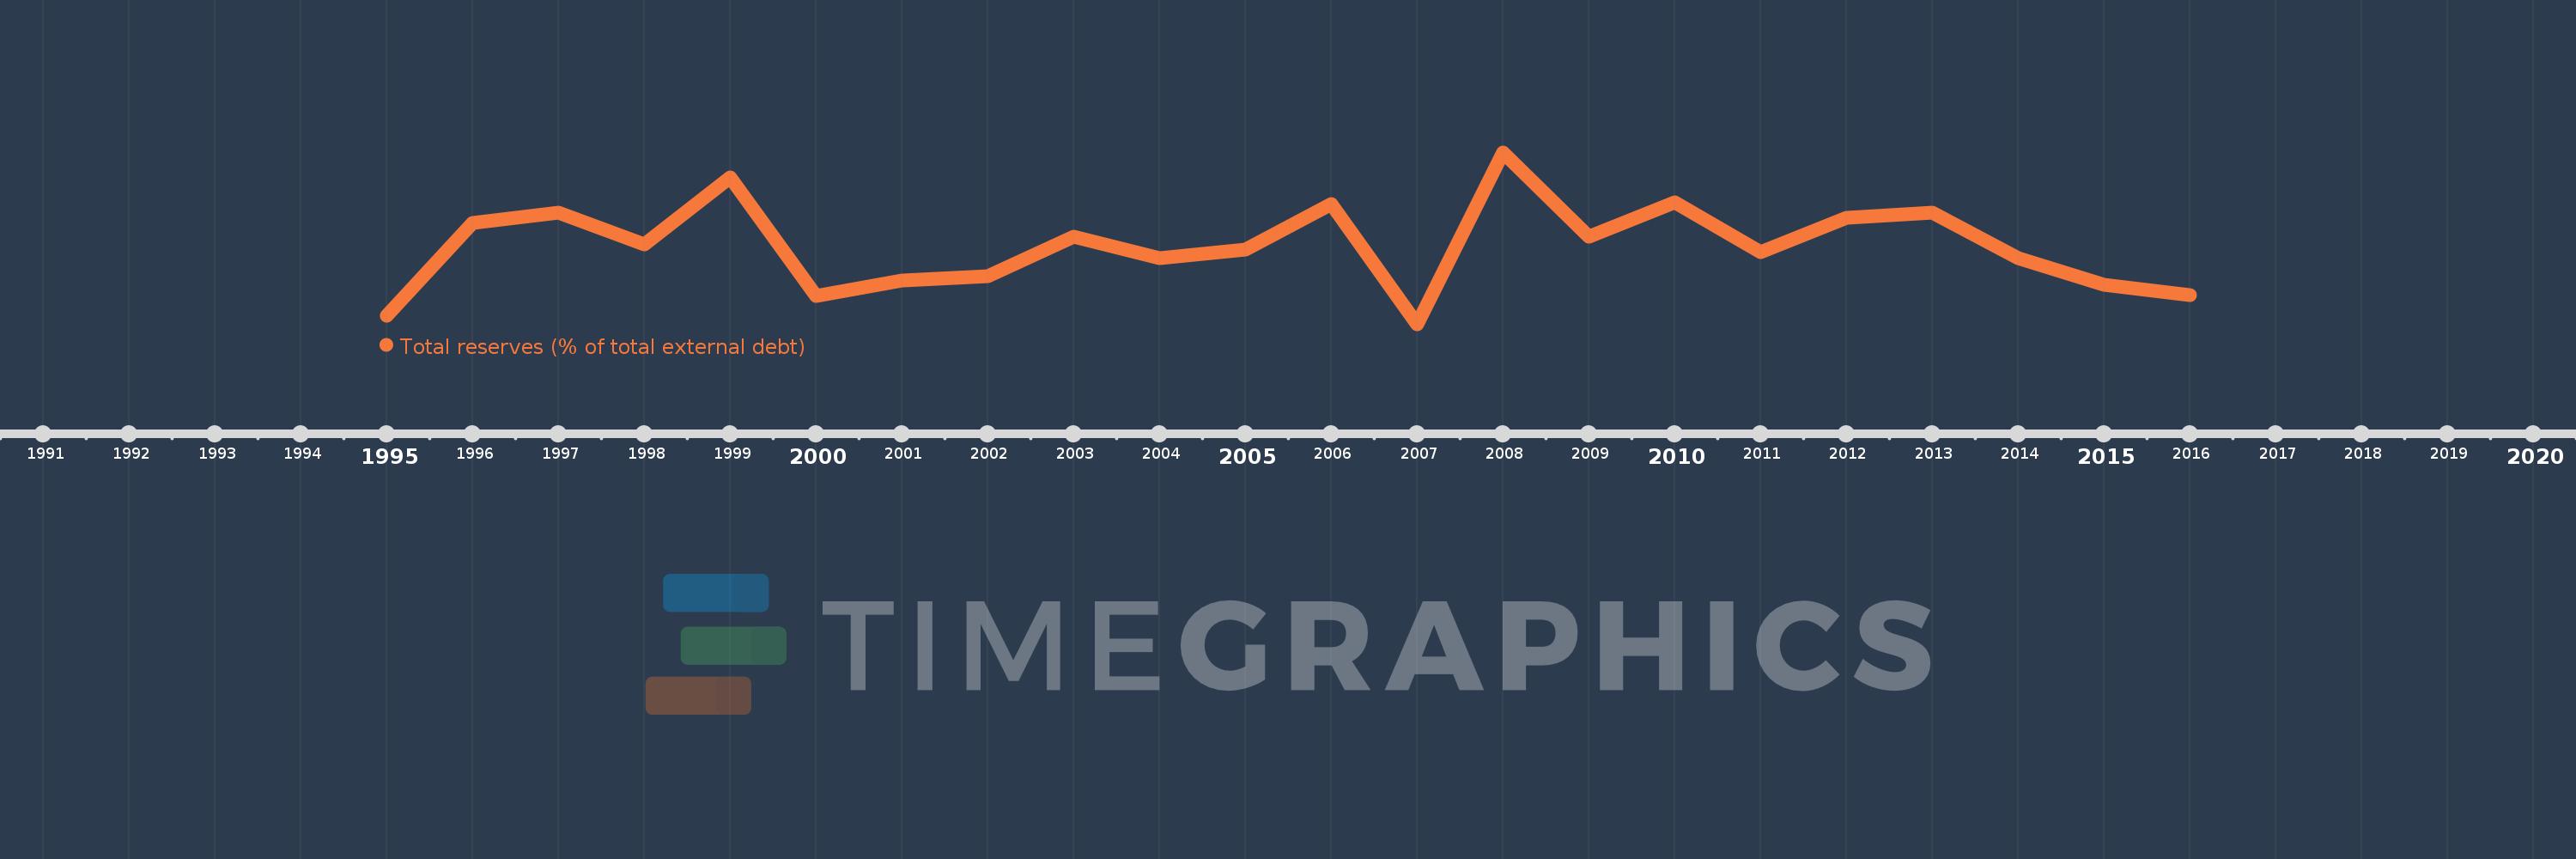
Diese Zeitleiste vorliegt die Graphik ab 1995 J. bis 2016 J. Belarus. Die Angaben bis 1994 J. sind nicht vorhanden. Die Zahl aktueller Beobachtungen nach Daten: 22.

Die Quelle (Bezeichnung):

Kennzahlen der Weltentwicklung

Die Quelle (Einrichtung):

World Bank, International Debt Statistics.

Kategorien:

Financial Sector, External Debt

Es wurde aktualisiert:

23 Apr 2017 Jahr

Kennzahlen der Wertänderungen vom Jahr zum Jahr

im Durchschnitt:
18.731
Minimum:
6.473
1 Jan 2007 Jahr
Maximum:
33.359
1 Jan 2008 Jahr
Zum Datum der Beobachtung
Wert
Absolute Veränderung
Die Veränderung bezüglich dem vorherigen Wert
1 Jan 1995 Jahr
7.792
+7.792
0.0%
1 Jan 1996 Jahr
22.26
+14.468
185.69%
1 Jan 1997 Jahr
23.949
+1.69
7.59%
1 Jan 1998 Jahr
18.907
-5.043
-21.06%
1 Jan 1999 Jahr
29.447
+10.541
55.75%
1 Jan 2000 Jahr
10.886
-18.562
-63.03%
1 Jan 2001 Jahr
13.377
+2.491
22.88%
1 Jan 2002 Jahr
13.959
+0.582
4.35%
1 Jan 2003 Jahr
20.222
+6.263
44.87%
1 Jan 2004 Jahr
16.842
-3.381
-16.72%
1 Jan 2005 Jahr
18.189
+1.348
8.0%
1 Jan 2006 Jahr
25.317
+7.127
39.18%
1 Jan 2007 Jahr
6.473
-18.843
-74.43%
1 Jan 2008 Jahr
33.359
+26.886
415.35%
1 Jan 2009 Jahr
20.215
-13.144
-39.4%
1 Jan 2010 Jahr
25.546
+5.331
26.37%
1 Jan 2011 Jahr
17.688
-7.858
-30.76%
1 Jan 2012 Jahr
23.173
+5.486
31.01%
1 Jan 2013 Jahr
23.981
+0.808
3.49%
1 Jan 2014 Jahr
16.817
-7.164
-29.87%
1 Jan 2015 Jahr
12.665
-4.152
-24.69%
1 Jan 2016 Jahr
11.017
-1.648
-13.01%

Bewertung der Länder gemäß mit laufender Statistik nach Jahren