33
/de/
AIzaSyAYiBZKx7MnpbEhh9jyipgxe19OcubqV5w
May 1, 2025
77447
Bahrain
BHR
true
2
1
Net official flows from UN agencies, UNICEF (current US$)
1999,1991,1989,1988,1987,1986,1984,1983,1980,1979,1978,1977,1976,1975,1974,1972,1971
Download
Bibliothek der Globalstatistik →Bahrain →

Net official flows from UN agencies, UNICEF (current US$)

Diese Statistik in anderen Ländern:

AfghanistanAlbaniaAlgeriaAngolaAntigua and BarbudaArab WorldArgentinaArmeniaAzerbaijanBahamas, TheBahrainBangladeshBarbadosBelarusBelizeBeninBhutanBoliviaBosnia and HerzegovinaBotswanaBrazilBulgariaBurkina FasoBurundiCabo VerdeCambodiaCameroonCaribbean small statesCentral African RepublicCentral Europe and the BalticsChadChileChinaColombiaComorosCongo, Dem. Rep.Congo, Rep.Costa RicaCote d'IvoireCroatiaCubaCyprusDjiboutiDominicaDominican RepublicEast Asia & PacificEast Asia & Pacific (excluding high income)East Asia & Pacific (IDA & IBRD countries)EcuadorEgypt, Arab Rep.El SalvadorEquatorial GuineaEritreaEthiopiaEuro areaEurope & Central AsiaEurope & Central Asia (excluding high income)Europe & Central Asia (IDA & IBRD countries)European UnionFijiFragile and conflict affected situationsGabonGambia, TheGeorgiaGhanaGrenadaGuatemalaGuineaGuinea-BissauGuyanaHaitiHeavily indebted poor countries (HIPC)High incomeHondurasHong Kong SAR, ChinaIBRD onlyIDA & IBRD totalIDA blendIDA onlyIDA totalIndiaIndonesiaIran, Islamic Rep.IraqJamaicaJordanKazakhstanKenyaKorea, Dem. People’s Rep.Korea, Rep.KosovoKuwaitKyrgyz RepublicLao PDRLatin America & Caribbean Latin America & Caribbean (excluding high income)Latin America & the Caribbean (IDA & IBRD countries)LatviaLeast developed countries: UN classificationLebanonLesothoLiberiaLibyaLow & middle incomeLow incomeLower middle incomeMacedonia, FYRMadagascarMalawiMalaysiaMaldivesMaliMauritaniaMauritiusMexicoMiddle East & North AfricaMiddle East & North Africa (excluding high income)Middle East & North Africa (IDA & IBRD countries)Middle incomeMoldovaMongoliaMontenegroMoroccoMozambiqueMyanmarNamibiaNepalNicaraguaNigerNigeriaNorthern Mariana IslandsOECD membersOmanOther small statesPacific island small statesPakistanPanamaPapua New GuineaParaguayPeruPhilippinesRomaniaRussian FederationRwandaSamoaSao Tome and PrincipeSaudi ArabiaSenegalSerbiaSeychellesSierra LeoneSingaporeSmall statesSomaliaSouth AfricaSouth AsiaSouth Asia (IDA & IBRD)South SudanSri LankaSt. Kitts and NevisSt. LuciaSt. Vincent and the GrenadinesSub-Saharan Africa Sub-Saharan Africa (excluding high income)Sub-Saharan Africa (IDA & IBRD countries)SudanSurinameSwazilandSyrian Arab RepublicTajikistanTanzaniaThailandTimor-LesteTogoTrinidad and TobagoTunisiaTurkeyTurkmenistanUgandaUkraineUnited Arab EmiratesUpper middle incomeUruguayUzbekistanVanuatuVenezuela, RBVietnamWest Bank and GazaWorldYemen, Rep.ZambiaZimbabwe

Zeitlinie:

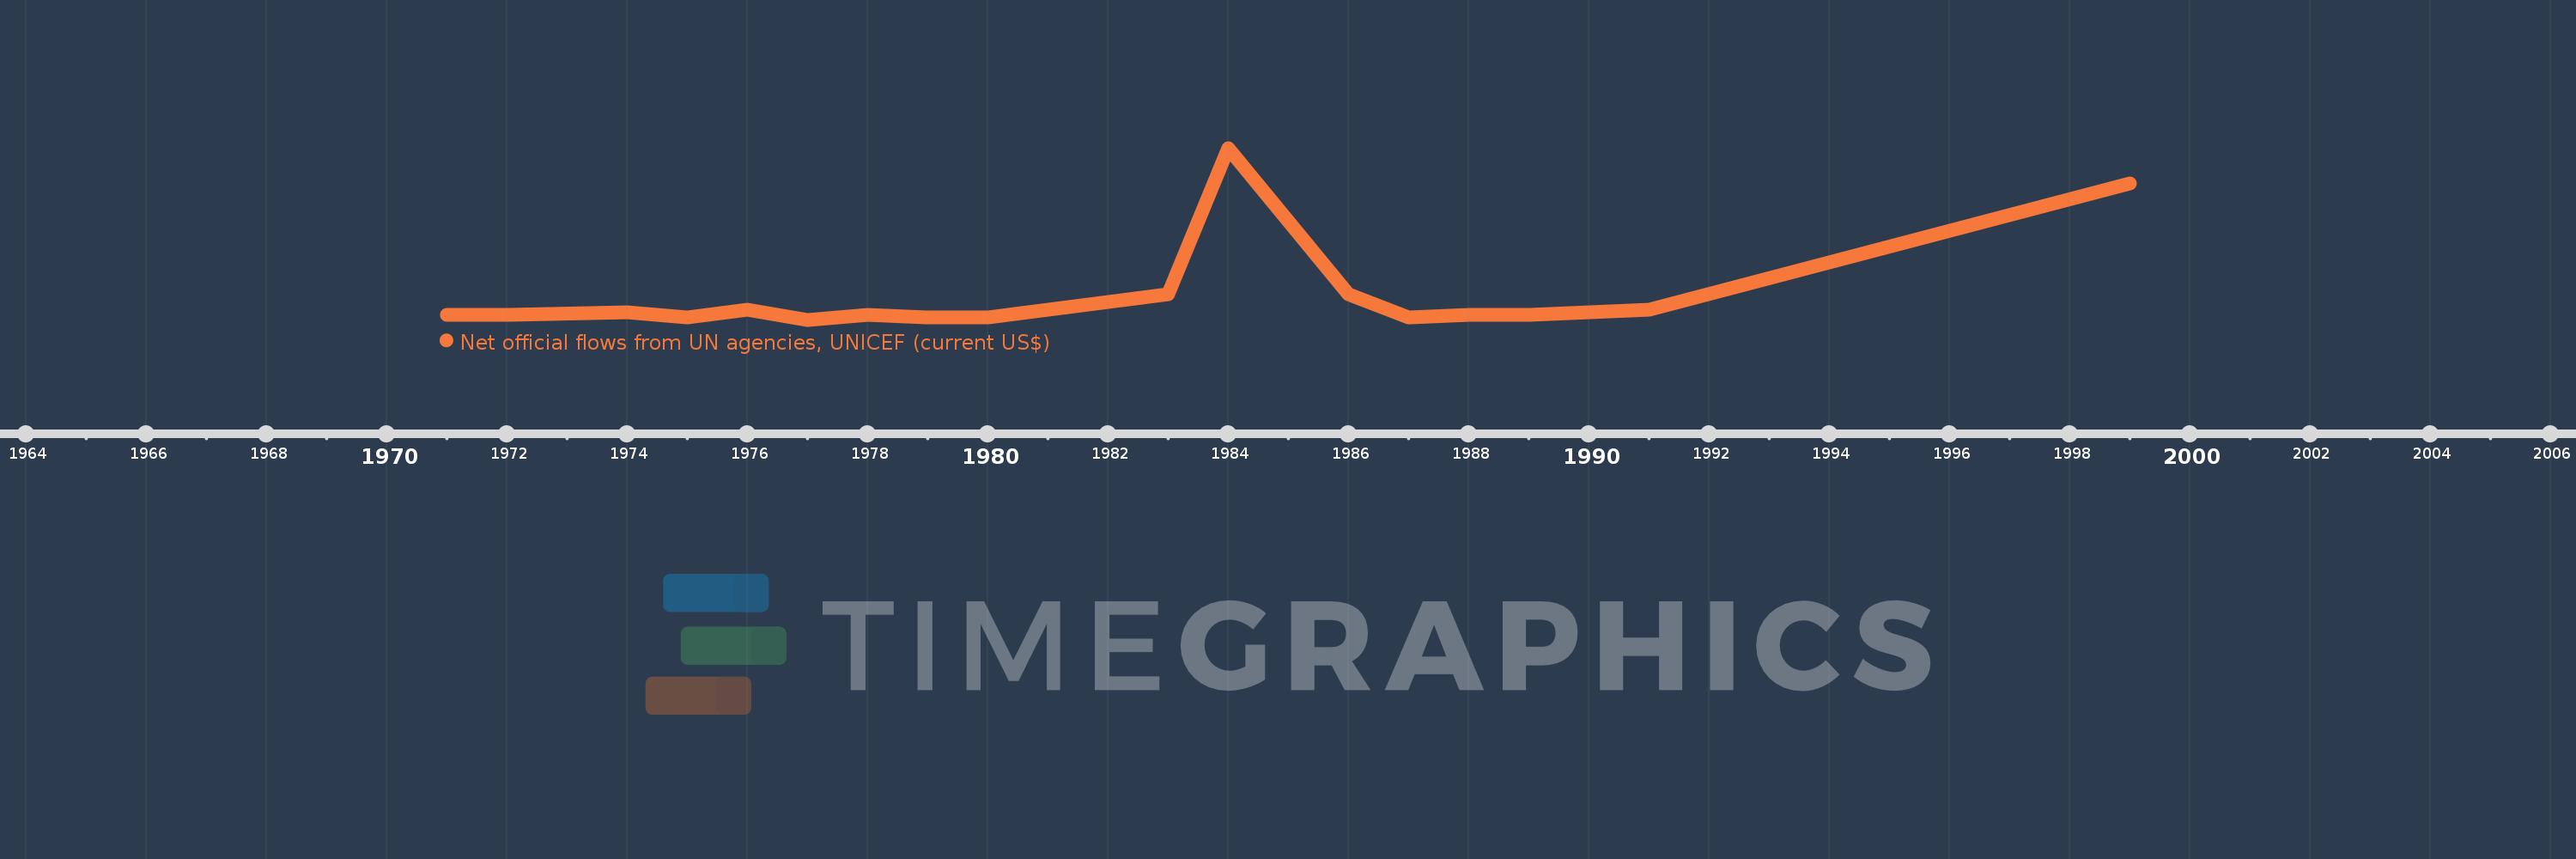
Diese Zeitleiste vorliegt die Graphik ab 1971 J. bis 1999 J. Bahrain. Die Angaben bis 1970 J. sind nicht vorhanden. Die Zahl aktueller Beobachtungen nach Daten: 17.

Die Quelle (Bezeichnung):

Kennzahlen der Weltentwicklung

Die Quelle (Einrichtung):

Development Assistance Committee of the Organisation for Economic Co-operation and Development, Geographical Distribution of Financial Flows to Developing Countries, Development Co-operation Report, and International Development Statistics database. Data are available online at: www.oecd.org/dac/stats/idsonline.

Kategorien:

Aid Effectiveness

Es wurde aktualisiert:

23 Apr 2017 Jahr

Kennzahlen der Wertänderungen vom Jahr zum Jahr

im Durchschnitt:
107.059 Tsnd.
Minimum:
10.0 Tsnd.
1 Jan 1977 Jahr
Maximum:
680.0 Tsnd.
1 Jan 1984 Jahr
Zum Datum der Beobachtung
Wert
Absolute Veränderung
Die Veränderung bezüglich dem vorherigen Wert
1 Jan 1971 Jahr
30.0 Tsnd.
+30.0 Tsnd.
0.0%
1 Jan 1972 Jahr
30.0 Tsnd.
0.0
0.0%
1 Jan 1974 Jahr
40.0 Tsnd.
+10.0 Tsnd.
33.33%
1 Jan 1975 Jahr
20.0 Tsnd.
-20.0 Tsnd.
-50.0%
1 Jan 1976 Jahr
50.0 Tsnd.
+30.0 Tsnd.
150.0%
1 Jan 1977 Jahr
10.0 Tsnd.
-40.0 Tsnd.
-80.0%
1 Jan 1978 Jahr
30.0 Tsnd.
+20.0 Tsnd.
200.0%
1 Jan 1979 Jahr
20.0 Tsnd.
-10.0 Tsnd.
-33.33%
1 Jan 1980 Jahr
20.0 Tsnd.
0.0
0.0%
1 Jan 1983 Jahr
110.0 Tsnd.
+90.0 Tsnd.
450.0%
1 Jan 1984 Jahr
680.0 Tsnd.
+570.0 Tsnd.
518.18%
1 Jan 1986 Jahr
110.0 Tsnd.
-570.0 Tsnd.
-83.82%
1 Jan 1987 Jahr
20.0 Tsnd.
-90.0 Tsnd.
-81.82%
1 Jan 1988 Jahr
30.0 Tsnd.
+10.0 Tsnd.
50.0%
1 Jan 1989 Jahr
30.0 Tsnd.
0.0
0.0%
1 Jan 1991 Jahr
50.0 Tsnd.
+20.0 Tsnd.
66.67%
1 Jan 1999 Jahr
540.0 Tsnd.
+490.0 Tsnd.
980.0%

Bewertung der Länder gemäß mit laufender Statistik nach Jahren