29
/de/
de
AIzaSyAYiBZKx7MnpbEhh9jyipgxe19OcubqV5w
April 1, 2024
77419
Bahrain
BHR
true
2
1
Net enrolment rate, secondary, both sexes (%)
2007,2006,2005,2004,2003,2002,2001,2000,1999,1998,1996,1995,1993,1990,1988,1987,1986,1985,1984,1983,1980,1979,1978
Download
Bibliothek der Globalstatistik →Bahrain →

Net enrolment rate, secondary, both sexes (%)

Diese Statistik in anderen Ländern:
AfghanistanAlbaniaAlgeriaAngolaAntigua and BarbudaArab WorldArgentinaArmeniaArubaAustraliaAustriaAzerbaijanBahamas, TheBahrainBangladeshBarbadosBelarusBelgiumBelizeBeninBermudaBhutanBoliviaBotswanaBrazilBritish Virgin IslandsBrunei DarussalamBulgariaBurkina FasoBurundiCabo VerdeCambodiaCameroonCanadaCaribbean small statesCentral African RepublicCentral Europe and the BalticsChadChileColombiaComorosCongo, Dem. Rep.Congo, Rep.Costa RicaCroatiaCubaCyprusDenmarkDjiboutiDominicaDominican RepublicEarly-demographic dividendEast Asia & PacificEast Asia & Pacific (excluding high income)East Asia & Pacific (IDA & IBRD countries)EcuadorEgypt, Arab Rep.El SalvadorEquatorial GuineaEritreaEstoniaEthiopiaEuro areaEurope & Central AsiaEurope & Central Asia (excluding high income)Europe & Central Asia (IDA & IBRD countries)European UnionFijiFinlandFragile and conflict affected situationsFranceGambia, TheGeorgiaGhanaGreeceGrenadaGuatemalaGuineaGuinea-BissauGuyanaHeavily indebted poor countries (HIPC)High incomeHondurasHong Kong SAR, ChinaHungaryIBRD onlyIcelandIDA & IBRD totalIDA blendIDA onlyIDA totalIndiaIndonesiaIran, Islamic Rep.IraqIrelandIsraelItalyJamaicaJapanJordanKazakhstanKenyaKiribatiKorea, Dem. People’s Rep.Korea, Rep.KuwaitKyrgyz RepublicLao PDRLate-demographic dividendLatin America & Caribbean Latin America & Caribbean (excluding high income)Latin America & the Caribbean (IDA & IBRD countries)LatviaLeast developed countries: UN classificationLebanonLesothoLibyaLiechtensteinLithuaniaLow & middle incomeLow incomeLower middle incomeLuxembourgMacao SAR, ChinaMacedonia, FYRMadagascarMalawiMalaysiaMaldivesMaliMaltaMarshall IslandsMauritaniaMauritiusMexicoMiddle East & North AfricaMiddle East & North Africa (excluding high income)Middle East & North Africa (IDA & IBRD countries)Middle incomeMoldovaMongoliaMoroccoMozambiqueMyanmarNamibiaNauruNepalNetherlandsNew ZealandNicaraguaNigerNorth AmericaNorwayOECD membersOmanOther small statesPacific island small statesPakistanPanamaParaguayPeruPhilippinesPolandPortugalPost-demographic dividendPre-demographic dividendPuerto RicoQatarRomaniaSamoaSao Tome and PrincipeSaudi ArabiaSenegalSerbiaSeychellesSierra LeoneSloveniaSmall statesSolomon IslandsSomaliaSouth AfricaSouth AsiaSouth Asia (IDA & IBRD)SpainSri LankaSt. Kitts and NevisSt. LuciaSt. Vincent and the GrenadinesSub-Saharan Africa Sub-Saharan Africa (excluding high income)Sub-Saharan Africa (IDA & IBRD countries)SurinameSwazilandSwedenSwitzerlandSyrian Arab RepublicTajikistanThailandTimor-LesteTogoTongaTrinidad and TobagoTunisiaTurkeyTuvaluUgandaUkraineUnited Arab EmiratesUnited KingdomUnited StatesUpper middle incomeUruguayVanuatuVenezuela, RBVietnamWest Bank and GazaWorldYemen, Rep.Zimbabwe
Zeitlinie:
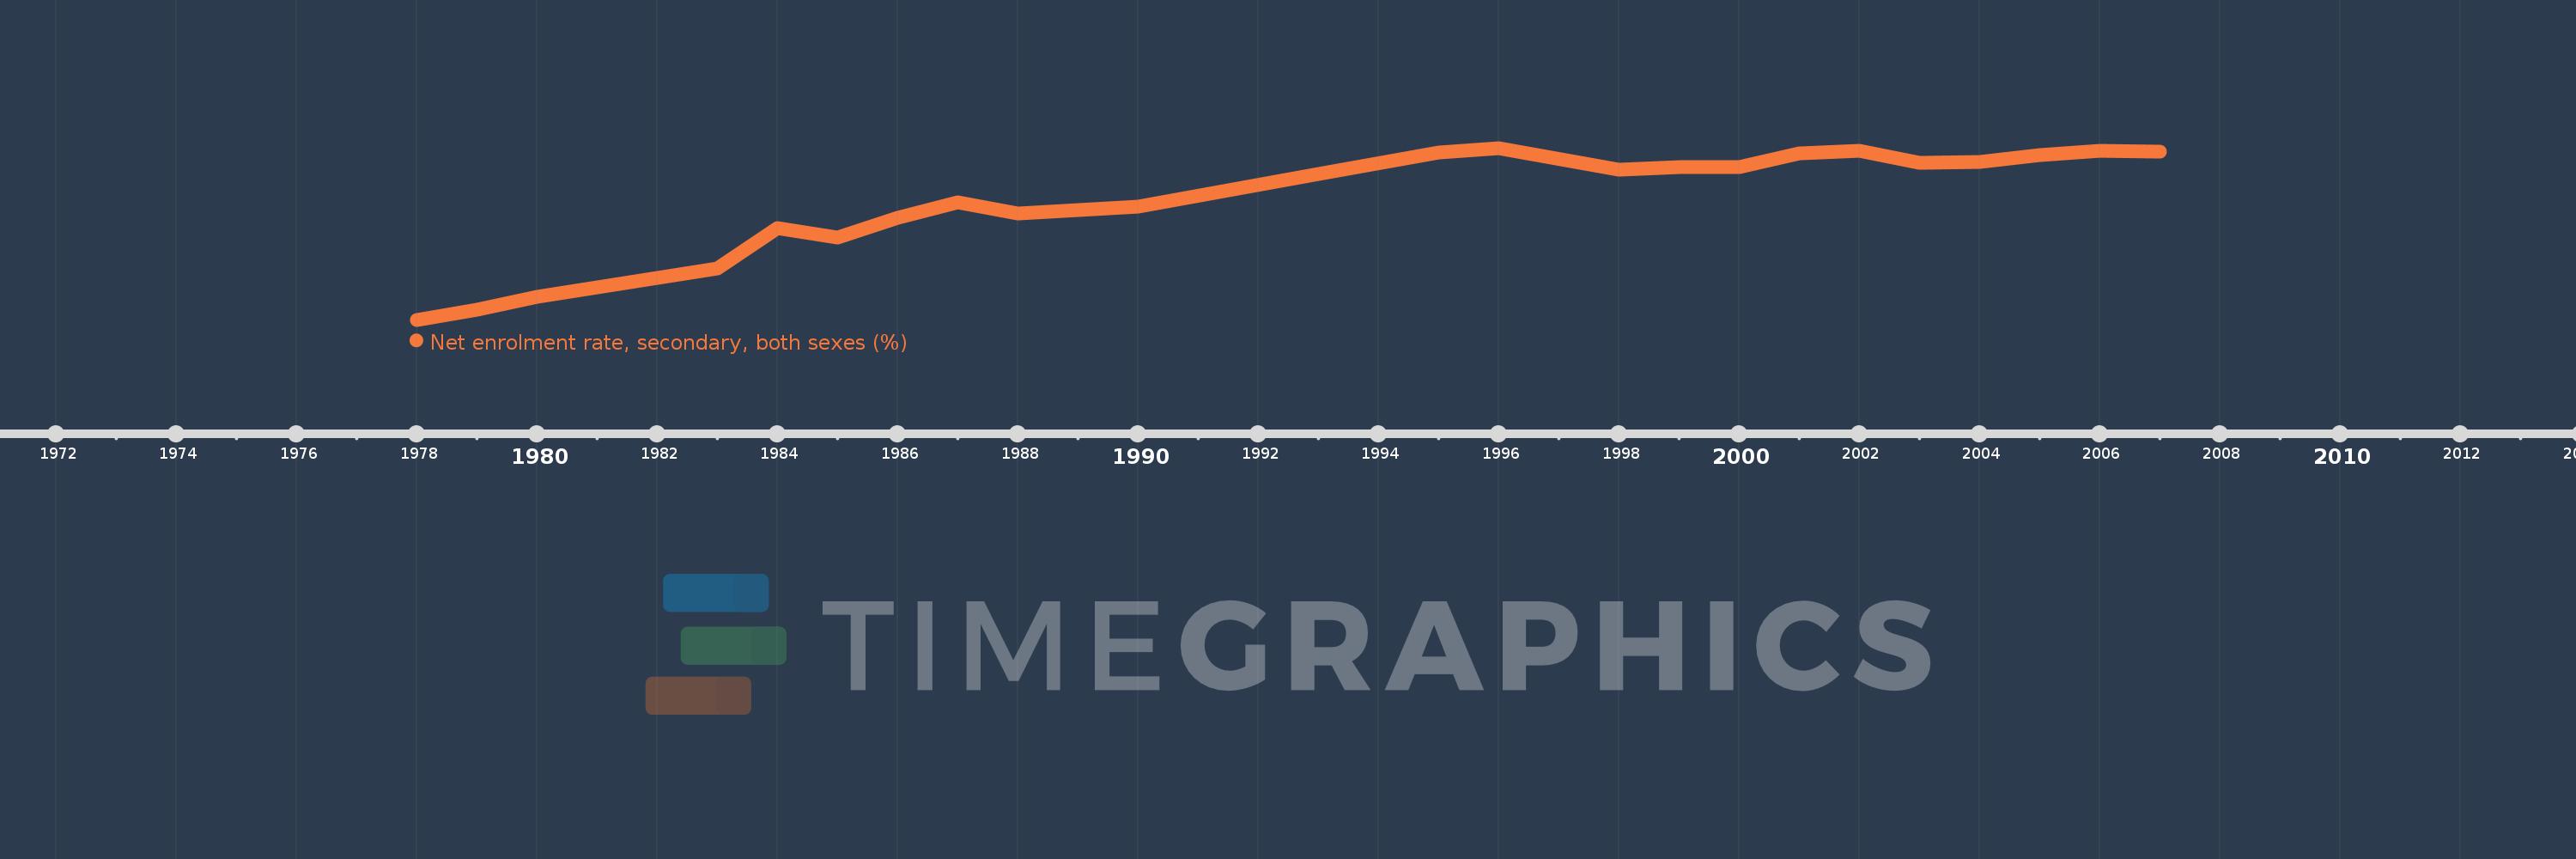
Diese Zeitleiste vorliegt die Graphik ab 1978 J. bis 2007 J. Bahrain. Die Angaben bis 1977 J. sind nicht vorhanden. Die Zahl aktueller Beobachtungen nach Daten: 23.
Die Quelle (Bezeichnung):
Kennzahlen der Weltentwicklung
Die Quelle (Einrichtung):
UNESCO Institute for Statistics
Kategorien:
Education
Es wurde aktualisiert:
23 Apr 2017 Jahr
Kennzahlen der Wertänderungen vom Jahr zum Jahr
im Durchschnitt:
78.006
Minimum:
44.471
1 Jan 1978 Jahr
Maximum:
91.999
1 Jan 1996 Jahr
Zum Datum der Beobachtung
Wert
Absolute Veränderung
Die Veränderung bezüglich dem vorherigen Wert
1 Jan 1978 Jahr
44.471
+44.471
0.0%
1 Jan 1979 Jahr
47.275
+2.803
6.3%
1 Jan 1980 Jahr
50.754
+3.48
7.36%
1 Jan 1983 Jahr
58.735
+7.981
15.72%
1 Jan 1984 Jahr
69.901
+11.167
19.01%
1 Jan 1985 Jahr
67.113
-2.789
-3.99%
1 Jan 1986 Jahr
72.651
+5.538
8.25%
1 Jan 1987 Jahr
76.874
+4.223
5.81%
1 Jan 1988 Jahr
73.891
-2.983
-3.88%
1 Jan 1990 Jahr
75.86
+1.969
2.66%
1 Jan 1993 Jahr
84.789
+8.929
11.77%
1 Jan 1995 Jahr
90.627
+5.838
6.89%
1 Jan 1996 Jahr
91.999
+1.372
1.51%
1 Jan 1998 Jahr
85.953
-6.046
-6.57%
1 Jan 1999 Jahr
86.671
+0.718
0.84%
1 Jan 2000 Jahr
86.632
-0.039
-0.04%
1 Jan 2001 Jahr
90.544
+3.912
4.52%
1 Jan 2002 Jahr
91.278
+0.733
0.81%
1 Jan 2003 Jahr
87.944
-3.334
-3.65%
1 Jan 2004 Jahr
88.122
+0.179
0.2%
1 Jan 2005 Jahr
89.919
+1.797
2.04%
1 Jan 2006 Jahr
91.241
+1.322
1.47%
1 Jan 2007 Jahr
90.903
-0.338
-0.37%
Bewertung der Länder gemäß mit laufender Statistik nach Jahren

Kommentare:

Abschicken
PremiumAbout & FeedbackVereinbarungPrivatheit
logo
© 2022 Selected Technologies LLC – Morgan Hill, California