33
/de/
AIzaSyAYiBZKx7MnpbEhh9jyipgxe19OcubqV5w
May 1, 2025
72393
Aruba
ABW
true
2
1
Net bilateral aid flows from DAC donors, European Union institutions (current US$)
2005,2004,2003,2002,2001,2000,1999,1998,1997,1996,1995,1994,1993,1992,1991,1990,1989
Download
Bibliothek der Globalstatistik →Aruba →

Net bilateral aid flows from DAC donors, European Union institutions (current US$)

Diese Statistik in anderen Ländern:

AfghanistanAlbaniaAlgeriaAngolaAntigua and BarbudaArab WorldArgentinaArmeniaArubaAzerbaijanBahamas, TheBahrainBangladeshBarbadosBelarusBelizeBeninBermudaBhutanBoliviaBosnia and HerzegovinaBotswanaBrazilBritish Virgin IslandsBrunei DarussalamBulgariaBurkina FasoBurundiCabo VerdeCambodiaCameroonCaribbean small statesCayman IslandsCentral African RepublicCentral Europe and the BalticsChadChileChinaColombiaComorosCongo, Dem. Rep.Congo, Rep.Costa RicaCote d'IvoireCroatiaCubaCyprusCzech RepublicDjiboutiDominicaDominican RepublicEast Asia & PacificEast Asia & Pacific (excluding high income)East Asia & Pacific (IDA & IBRD countries)EcuadorEgypt, Arab Rep.El SalvadorEquatorial GuineaEritreaEstoniaEthiopiaEuro areaEurope & Central AsiaEurope & Central Asia (excluding high income)Europe & Central Asia (IDA & IBRD countries)European UnionFijiFragile and conflict affected situationsFrench PolynesiaGabonGambia, TheGeorgiaGhanaGrenadaGuatemalaGuineaGuinea-BissauGuyanaHaitiHeavily indebted poor countries (HIPC)High incomeHondurasHong Kong SAR, ChinaHungaryIBRD onlyIDA & IBRD totalIDA blendIDA onlyIDA totalIndiaIndonesiaIran, Islamic Rep.IraqIsraelJamaicaJordanKazakhstanKenyaKiribatiKorea, Dem. People’s Rep.Korea, Rep.KosovoKyrgyz RepublicLao PDRLatin America & Caribbean Latin America & Caribbean (excluding high income)Latin America & the Caribbean (IDA & IBRD countries)LatviaLeast developed countries: UN classificationLebanonLesothoLiberiaLibyaLithuaniaLow & middle incomeLow incomeLower middle incomeMacao SAR, ChinaMacedonia, FYRMadagascarMalawiMalaysiaMaldivesMaliMaltaMarshall IslandsMauritaniaMauritiusMexicoMicronesia, Fed. Sts.Middle East & North AfricaMiddle East & North Africa (excluding high income)Middle East & North Africa (IDA & IBRD countries)Middle incomeMoldovaMongoliaMontenegroMoroccoMozambiqueMyanmarNamibiaNauruNepalNew CaledoniaNicaraguaNigerNigeriaNorth AmericaOECD membersOmanOther small statesPacific island small statesPakistanPalauPanamaPapua New GuineaParaguayPeruPhilippinesPolandQatarRomaniaRussian FederationRwandaSamoaSao Tome and PrincipeSaudi ArabiaSenegalSerbiaSeychellesSierra LeoneSingaporeSlovak RepublicSloveniaSmall statesSolomon IslandsSomaliaSouth AfricaSouth AsiaSouth Asia (IDA & IBRD)South SudanSri LankaSt. Kitts and NevisSt. LuciaSt. Vincent and the GrenadinesSub-Saharan Africa Sub-Saharan Africa (excluding high income)Sub-Saharan Africa (IDA & IBRD countries)SudanSurinameSwazilandSyrian Arab RepublicTajikistanTanzaniaThailandTimor-LesteTogoTongaTrinidad and TobagoTunisiaTurkeyTurkmenistanTurks and Caicos IslandsTuvaluUgandaUkraineUnited Arab EmiratesUpper middle incomeUruguayUzbekistanVanuatuVenezuela, RBVietnamWest Bank and GazaWorldYemen, Rep.ZambiaZimbabwe

Zeitlinie:

Diese Zeitleiste vorliegt die Graphik ab 1989 J. bis 2005 J. Aruba. Die Angaben bis 1988 J. sind nicht vorhanden. Die Zahl aktueller Beobachtungen nach Daten: 17.

Die Quelle (Bezeichnung):

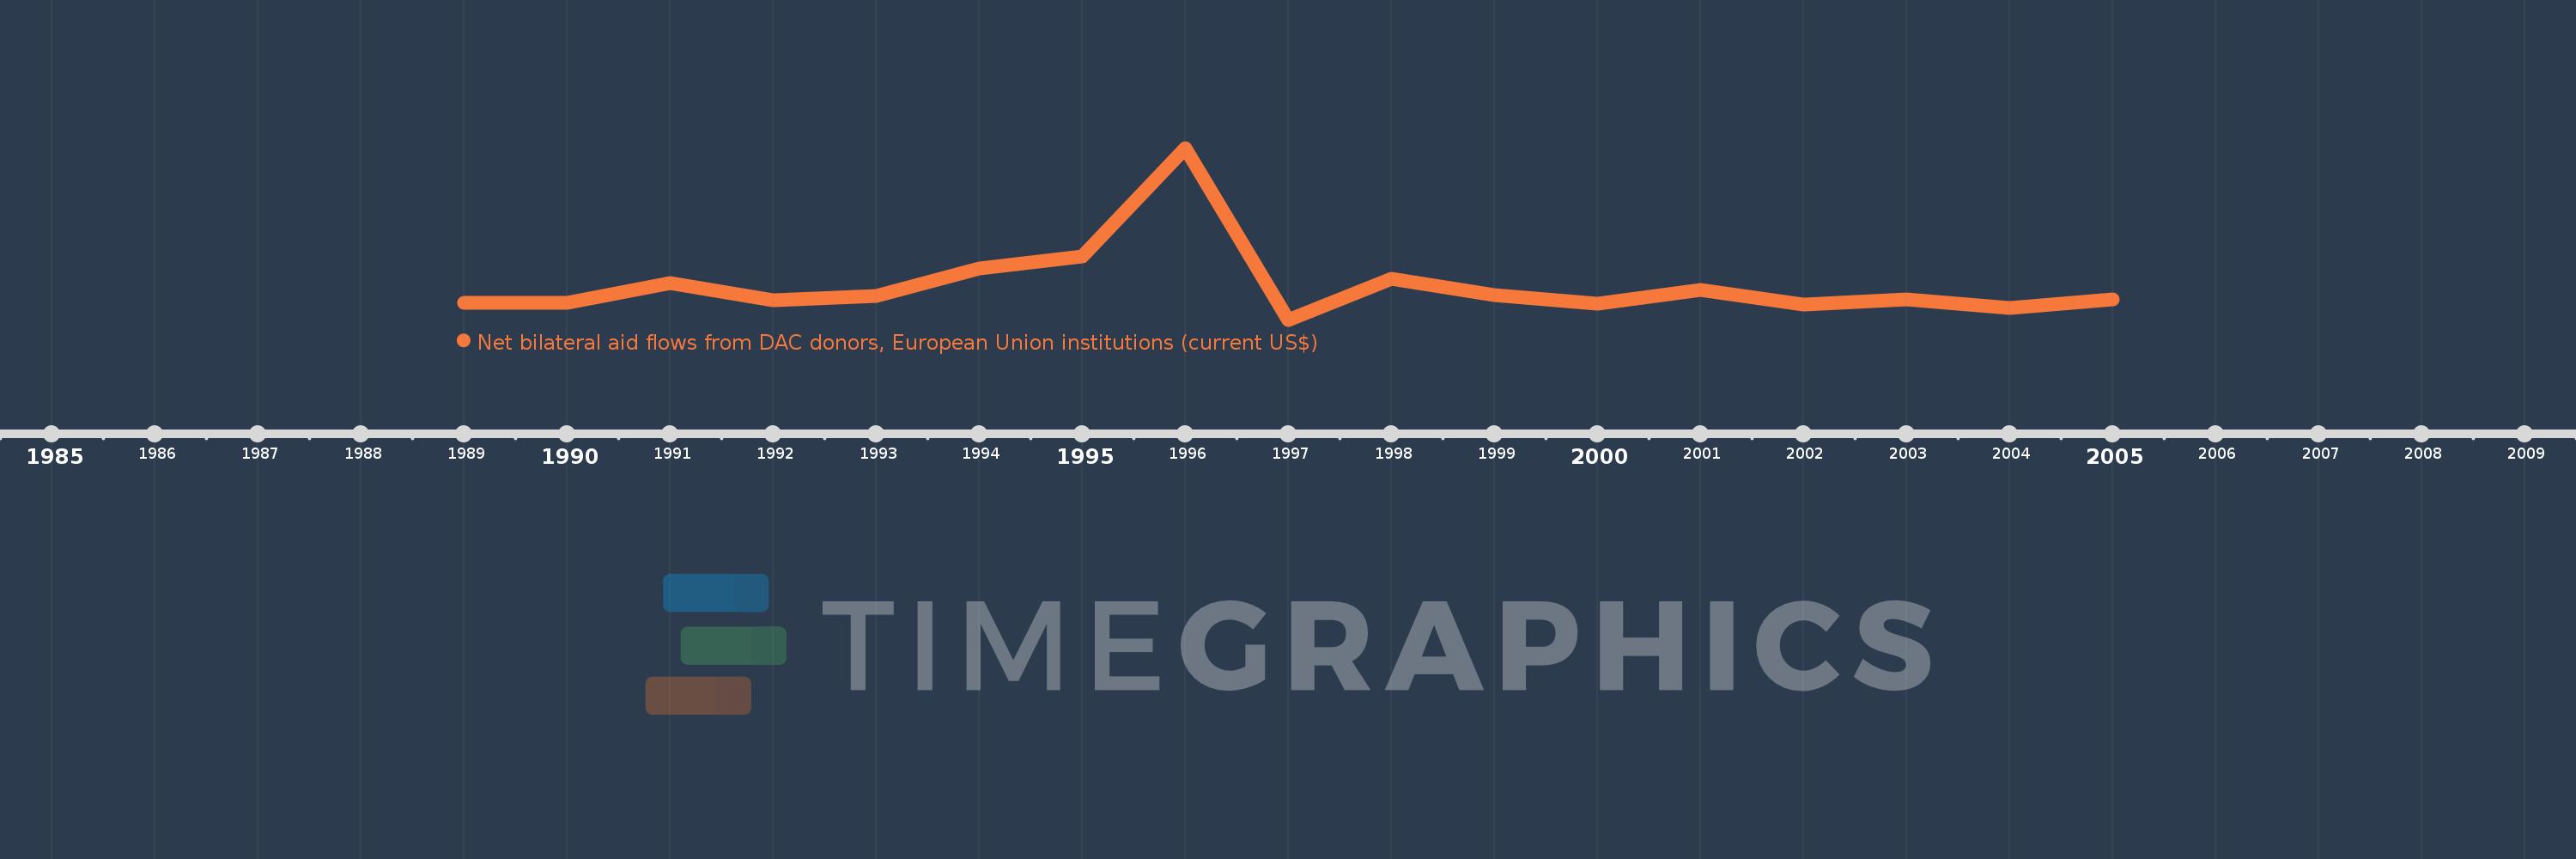
Kennzahlen der Weltentwicklung

Die Quelle (Einrichtung):

Development Assistance Committee of the Organisation for Economic Co-operation and Development, Geographical Distribution of Financial Flows to Developing Countries, Development Co-operation Report, and International Development Statistics database. Data are available online at: www.oecd.org/dac/stats/idsonline.

Kategorien:

Aid Effectiveness

Es wurde aktualisiert:

23 Apr 2017 Jahr

Kennzahlen der Wertänderungen vom Jahr zum Jahr

im Durchschnitt:
886.471 Tsnd.
Minimum:
-840.0 Tsnd.
1 Jan 1997 Jahr
Maximum:
7.86 Mln.
1 Jan 1996 Jahr
Zum Datum der Beobachtung
Wert
Absolute Veränderung
Die Veränderung bezüglich dem vorherigen Wert
1 Jan 1989 Jahr
30.0 Tsnd.
+30.0 Tsnd.
0.0%
1 Jan 1990 Jahr
30.0 Tsnd.
0.0
0.0%
1 Jan 1991 Jahr
1000.0 Tsnd.
+970.0 Tsnd.
3.23 Tsnd.%
1 Jan 1992 Jahr
150.0 Tsnd.
-850.0 Tsnd.
-85.0%
1 Jan 1993 Jahr
380.0 Tsnd.
+230.0 Tsnd.
153.33%
1 Jan 1994 Jahr
1.76 Mln.
+1.38 Mln.
363.16%
1 Jan 1995 Jahr
2.36 Mln.
+600.0 Tsnd.
34.09%
1 Jan 1996 Jahr
7.86 Mln.
+5.5 Mln.
233.05%
1 Jan 1997 Jahr
-840.0 Tsnd.
-8.7 Mln.
-110.69%
1 Jan 1998 Jahr
1.24 Mln.
+2.08 Mln.
-247.62%
1 Jan 1999 Jahr
410.0 Tsnd.
-830.0 Tsnd.
-66.94%
1 Jan 2000 Jahr
-40.0 Tsnd.
-450.0 Tsnd.
-109.76%
1 Jan 2001 Jahr
690.0 Tsnd.
+730.0 Tsnd.
-1.82 Tsnd.%
1 Jan 2002 Jahr
-80.0 Tsnd.
-770.0 Tsnd.
-111.59%
1 Jan 2003 Jahr
180.0 Tsnd.
+260.0 Tsnd.
-325.0%
1 Jan 2004 Jahr
-250.0 Tsnd.
-430.0 Tsnd.
-238.89%
1 Jan 2005 Jahr
190.0 Tsnd.
+440.0 Tsnd.
-176.0%

Bewertung der Länder gemäß mit laufender Statistik nach Jahren