29
/de/
de
AIzaSyAYiBZKx7MnpbEhh9jyipgxe19OcubqV5w
April 1, 2024
65130
Albania
ALB
true
2
1
Net official flows from UN agencies, UNTA (current US$)
2009,2008,2007,2006,2005,2004,2003,2002,2001,2000,1999,1998,1997,1996,1995,1994,1993,1992,1991,1990,1989
Download
Bibliothek der Globalstatistik →Albania →

Net official flows from UN agencies, UNTA (current US$)

Diese Statistik in anderen Ländern:
AfghanistanAlbaniaAlgeriaAngolaAntigua and BarbudaArab WorldArgentinaArmeniaArubaAzerbaijanBahamas, TheBahrainBangladeshBarbadosBelarusBelizeBeninBermudaBhutanBoliviaBosnia and HerzegovinaBotswanaBrazilBritish Virgin IslandsBrunei DarussalamBulgariaBurkina FasoBurundiCabo VerdeCambodiaCameroonCaribbean small statesCayman IslandsCentral African RepublicCentral Europe and the BalticsChadChileChinaColombiaComorosCongo, Dem. Rep.Congo, Rep.Costa RicaCote d'IvoireCroatiaCubaCyprusCzech RepublicDjiboutiDominicaDominican RepublicEast Asia & PacificEast Asia & Pacific (excluding high income)East Asia & Pacific (IDA & IBRD countries)EcuadorEgypt, Arab Rep.El SalvadorEquatorial GuineaEritreaEstoniaEthiopiaEuro areaEurope & Central AsiaEurope & Central Asia (excluding high income)Europe & Central Asia (IDA & IBRD countries)European UnionFijiFragile and conflict affected situationsFrench PolynesiaGabonGambia, TheGeorgiaGhanaGrenadaGuatemalaGuineaGuinea-BissauGuyanaHaitiHeavily indebted poor countries (HIPC)High incomeHondurasHong Kong SAR, ChinaHungaryIBRD onlyIDA & IBRD totalIDA blendIDA onlyIDA totalIndiaIndonesiaIran, Islamic Rep.IraqIsraelJamaicaJordanKazakhstanKenyaKiribatiKorea, Dem. People’s Rep.Korea, Rep.KuwaitKyrgyz RepublicLao PDRLatin America & Caribbean Latin America & Caribbean (excluding high income)Latin America & the Caribbean (IDA & IBRD countries)LatviaLeast developed countries: UN classificationLebanonLesothoLiberiaLibyaLithuaniaLow & middle incomeLow incomeLower middle incomeMacao SAR, ChinaMacedonia, FYRMadagascarMalawiMalaysiaMaldivesMaliMaltaMarshall IslandsMauritaniaMauritiusMexicoMicronesia, Fed. Sts.Middle East & North AfricaMiddle East & North Africa (excluding high income)Middle East & North Africa (IDA & IBRD countries)Middle incomeMoldovaMongoliaMontenegroMoroccoMozambiqueMyanmarNamibiaNauruNepalNew CaledoniaNicaraguaNigerNigeriaNorth AmericaNorthern Mariana IslandsOECD membersOmanOther small statesPacific island small statesPakistanPalauPanamaPapua New GuineaParaguayPeruPhilippinesPolandQatarRomaniaRussian FederationRwandaSamoaSao Tome and PrincipeSaudi ArabiaSenegalSerbiaSeychellesSierra LeoneSingaporeSlovak RepublicSloveniaSmall statesSolomon IslandsSomaliaSouth AfricaSouth AsiaSouth Asia (IDA & IBRD)Sri LankaSt. Kitts and NevisSt. LuciaSt. Vincent and the GrenadinesSub-Saharan Africa Sub-Saharan Africa (excluding high income)Sub-Saharan Africa (IDA & IBRD countries)SudanSurinameSwazilandSyrian Arab RepublicTajikistanTanzaniaThailandTimor-LesteTogoTongaTrinidad and TobagoTunisiaTurkeyTurkmenistanTurks and Caicos IslandsTuvaluUgandaUkraineUnited Arab EmiratesUpper middle incomeUruguayUzbekistanVanuatuVenezuela, RBVietnamWest Bank and GazaWorldYemen, Rep.ZambiaZimbabwe
Zeitlinie:
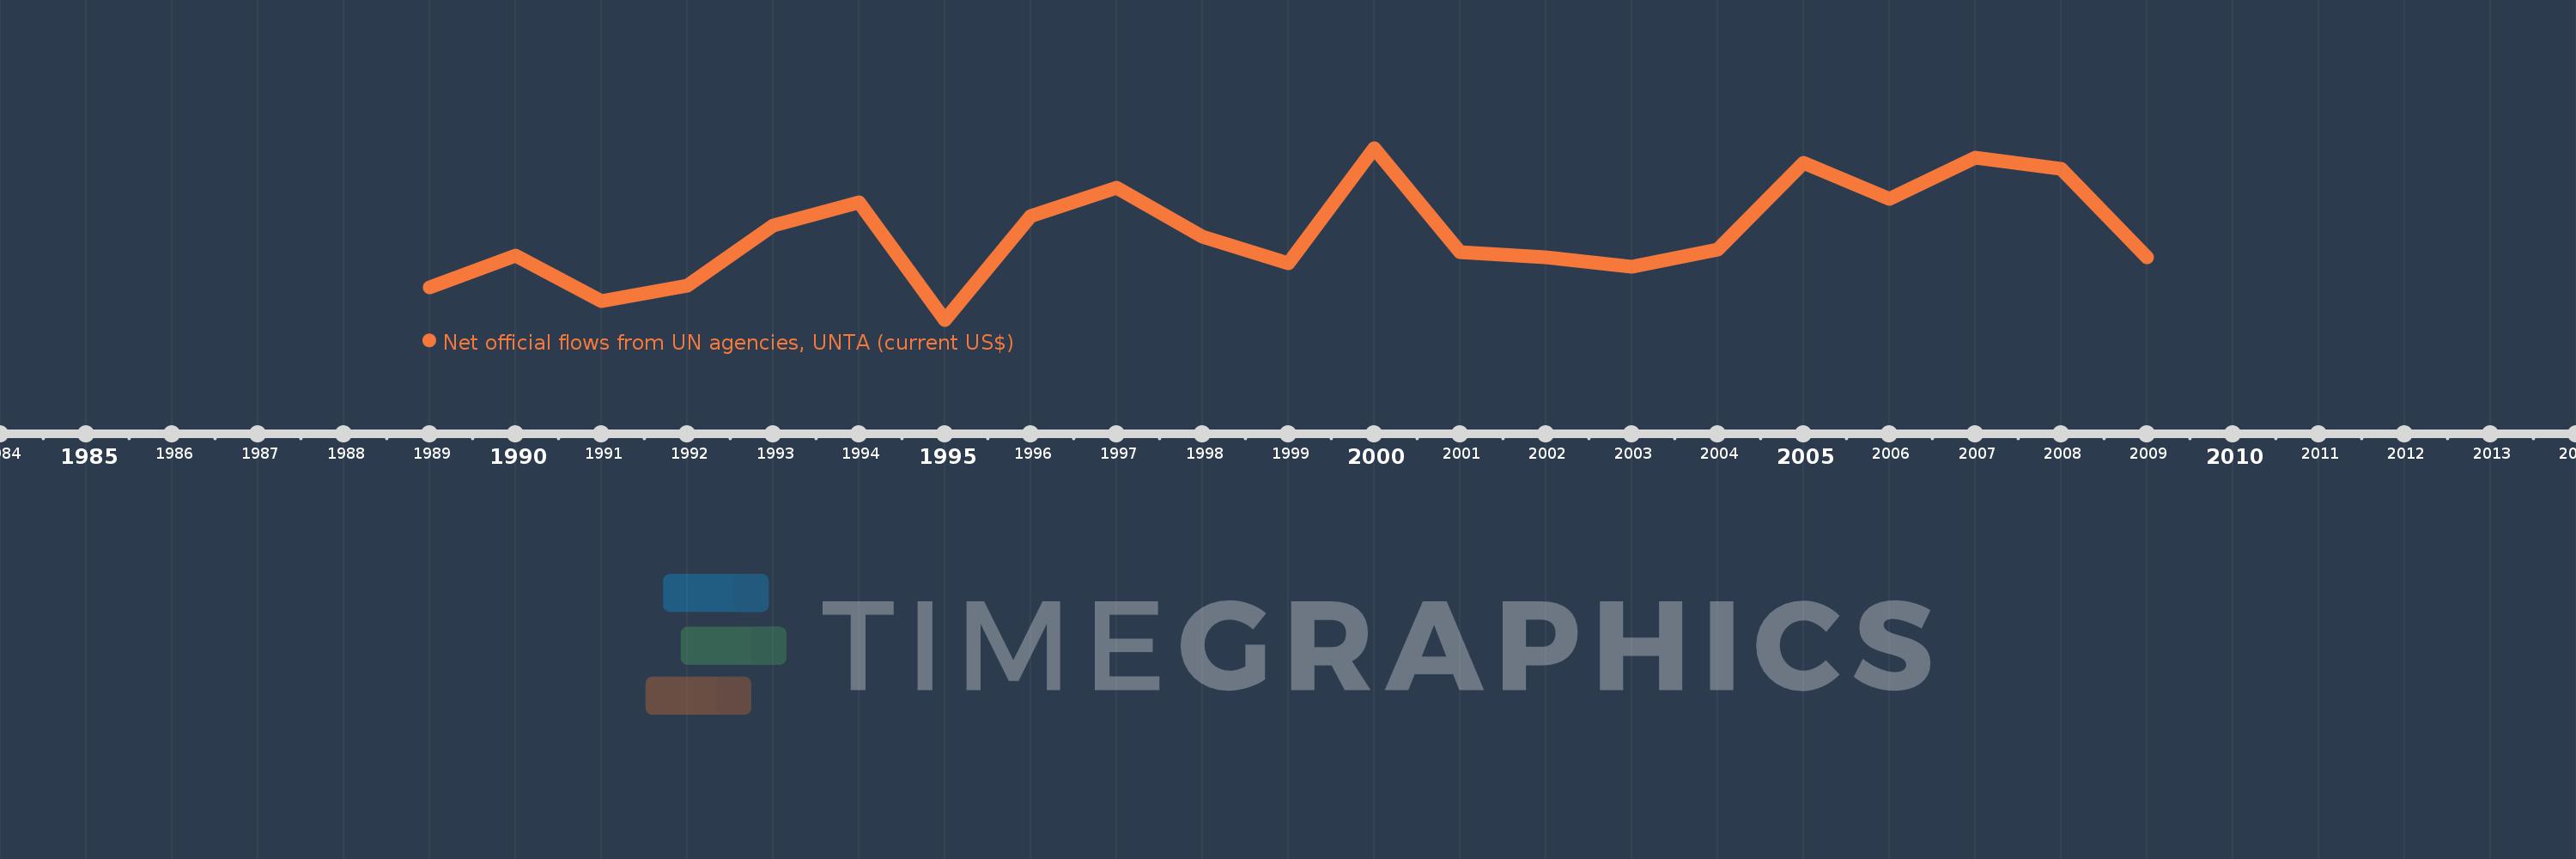
Diese Zeitleiste vorliegt die Graphik ab 1989 J. bis 2009 J. Albania. Die Angaben bis 1988 J. sind nicht vorhanden. Die Zahl aktueller Beobachtungen nach Daten: 21.
Die Quelle (Bezeichnung):
Kennzahlen der Weltentwicklung
Die Quelle (Einrichtung):
Development Assistance Committee of the Organisation for Economic Co-operation and Development, Geographical Distribution of Financial Flows to Developing Countries, Development Co-operation Report, and International Development Statistics database. Data are available online at: www.oecd.org/dac/stats/idsonline.
Kategorien:
Aid Effectiveness
Es wurde aktualisiert:
23 Apr 2017 Jahr
Kennzahlen der Wertänderungen vom Jahr zum Jahr
im Durchschnitt:
547.619 Tsnd.
Minimum:
90.0 Tsnd.
1 Jan 1995 Jahr
Maximum:
1000.0 Tsnd.
1 Jan 2000 Jahr
Zum Datum der Beobachtung
Wert
Absolute Veränderung
Die Veränderung bezüglich dem vorherigen Wert
1 Jan 1989 Jahr
260.0 Tsnd.
+260.0 Tsnd.
0.0%
1 Jan 1990 Jahr
430.0 Tsnd.
+170.0 Tsnd.
65.38%
1 Jan 1991 Jahr
190.0 Tsnd.
-240.0 Tsnd.
-55.81%
1 Jan 1992 Jahr
270.0 Tsnd.
+80.0 Tsnd.
42.11%
1 Jan 1993 Jahr
590.0 Tsnd.
+320.0 Tsnd.
118.52%
1 Jan 1994 Jahr
710.0 Tsnd.
+120.0 Tsnd.
20.34%
1 Jan 1995 Jahr
90.0 Tsnd.
-620.0 Tsnd.
-87.32%
1 Jan 1996 Jahr
640.0 Tsnd.
+550.0 Tsnd.
611.11%
1 Jan 1997 Jahr
790.0 Tsnd.
+150.0 Tsnd.
23.44%
1 Jan 1998 Jahr
530.0 Tsnd.
-260.0 Tsnd.
-32.91%
1 Jan 1999 Jahr
390.0 Tsnd.
-140.0 Tsnd.
-26.42%
1 Jan 2000 Jahr
1000.0 Tsnd.
+610.0 Tsnd.
156.41%
1 Jan 2001 Jahr
450.0 Tsnd.
-550.0 Tsnd.
-55.0%
1 Jan 2002 Jahr
420.0 Tsnd.
-30.0 Tsnd.
-6.67%
1 Jan 2003 Jahr
370.0 Tsnd.
-50.0 Tsnd.
-11.9%
1 Jan 2004 Jahr
460.0 Tsnd.
+90.0 Tsnd.
24.32%
1 Jan 2005 Jahr
920.0 Tsnd.
+460.0 Tsnd.
100.0%
1 Jan 2006 Jahr
730.0 Tsnd.
-190.0 Tsnd.
-20.65%
1 Jan 2007 Jahr
950.0 Tsnd.
+220.0 Tsnd.
30.14%
1 Jan 2008 Jahr
890.0 Tsnd.
-60.0 Tsnd.
-6.32%
1 Jan 2009 Jahr
420.0 Tsnd.
-470.0 Tsnd.
-52.81%
Bewertung der Länder gemäß mit laufender Statistik nach Jahren

Kommentare:

Abschicken
PremiumAbout & FeedbackVereinbarungPrivatheit
logo
© 2022 Selected Technologies LLC – Morgan Hill, California