29
/de/
de
AIzaSyAYiBZKx7MnpbEhh9jyipgxe19OcubqV5w
April 1, 2024
62974
World
WLD
false
2
1
Primary income payments (BoP, current US$)
2016,2015,2014,2013,2012,2011,2010,2009,2008,2007,2006,2005,2004,2003,2002,2001,2000,1999,1998,1997,1996,1995,1994
Download
Bibliothek der Globalstatistik →World →

Primary income payments (BoP, current US$)

Diese Statistik in anderen Ländern:
AfghanistanAlbaniaAlgeriaAngolaAntigua and BarbudaArab WorldArgentinaArmeniaArubaAustraliaAustriaAzerbaijanBahamas, TheBahrainBangladeshBarbadosBelarusBelgiumBelizeBeninBermudaBhutanBoliviaBosnia and HerzegovinaBotswanaBrazilBrunei DarussalamBulgariaBurkina FasoBurundiCabo VerdeCambodiaCameroonCanadaCaribbean small statesCentral African RepublicCentral Europe and the BalticsChadChileChinaColombiaComorosCongo, Dem. Rep.Congo, Rep.Costa RicaCote d'IvoireCroatiaCuracaoCyprusCzech RepublicDenmarkDjiboutiDominicaDominican RepublicEarly-demographic dividendEast Asia & PacificEast Asia & Pacific (excluding high income)East Asia & Pacific (IDA & IBRD countries)EcuadorEgypt, Arab Rep.El SalvadorEquatorial GuineaEritreaEstoniaEthiopiaEuro areaEurope & Central AsiaEurope & Central Asia (excluding high income)Europe & Central Asia (IDA & IBRD countries)European UnionFaroe IslandsFijiFinlandFragile and conflict affected situationsFranceFrench PolynesiaGabonGambia, TheGeorgiaGermanyGhanaGreeceGrenadaGuatemalaGuineaGuinea-BissauGuyanaHaitiHeavily indebted poor countries (HIPC)High incomeHondurasHong Kong SAR, ChinaHungaryIBRD onlyIcelandIDA & IBRD totalIDA blendIDA onlyIDA totalIndiaIndonesiaIran, Islamic Rep.IraqIrelandIsraelItalyJamaicaJapanJordanKazakhstanKenyaKiribatiKorea, Rep.KosovoKuwaitKyrgyz RepublicLao PDRLate-demographic dividendLatin America & Caribbean Latin America & Caribbean (excluding high income)Latin America & the Caribbean (IDA & IBRD countries)LatviaLeast developed countries: UN classificationLebanonLesothoLiberiaLibyaLithuaniaLow & middle incomeLow incomeLower middle incomeLuxembourgMacao SAR, ChinaMacedonia, FYRMadagascarMalawiMalaysiaMaldivesMaliMaltaMarshall IslandsMauritaniaMauritiusMexicoMicronesia, Fed. Sts.Middle East & North AfricaMiddle East & North Africa (excluding high income)Middle East & North Africa (IDA & IBRD countries)Middle incomeMoldovaMongoliaMontenegroMoroccoMozambiqueMyanmarNamibiaNepalNetherlandsNew CaledoniaNew ZealandNicaraguaNigerNigeriaNorth AmericaNorwayOECD membersOmanOther small statesPacific island small statesPakistanPalauPanamaPapua New GuineaParaguayPeruPhilippinesPolandPortugalPost-demographic dividendPre-demographic dividendQatarRomaniaRussian FederationRwandaSamoaSao Tome and PrincipeSaudi ArabiaSenegalSerbiaSeychellesSierra LeoneSingaporeSint Maarten (Dutch part)Slovak RepublicSloveniaSmall statesSolomon IslandsSouth AfricaSouth AsiaSouth Asia (IDA & IBRD)South SudanSpainSri LankaSt. Kitts and NevisSt. LuciaSt. Vincent and the GrenadinesSub-Saharan Africa Sub-Saharan Africa (excluding high income)Sub-Saharan Africa (IDA & IBRD countries)SudanSurinameSwazilandSwedenSwitzerlandSyrian Arab RepublicTajikistanTanzaniaThailandTimor-LesteTogoTongaTrinidad and TobagoTunisiaTurkeyTuvaluUgandaUkraineUnited KingdomUnited StatesUpper middle incomeUruguayVanuatuVenezuela, RBVietnamWest Bank and GazaWorldYemen, Rep.ZambiaZimbabwe
Zeitlinie:
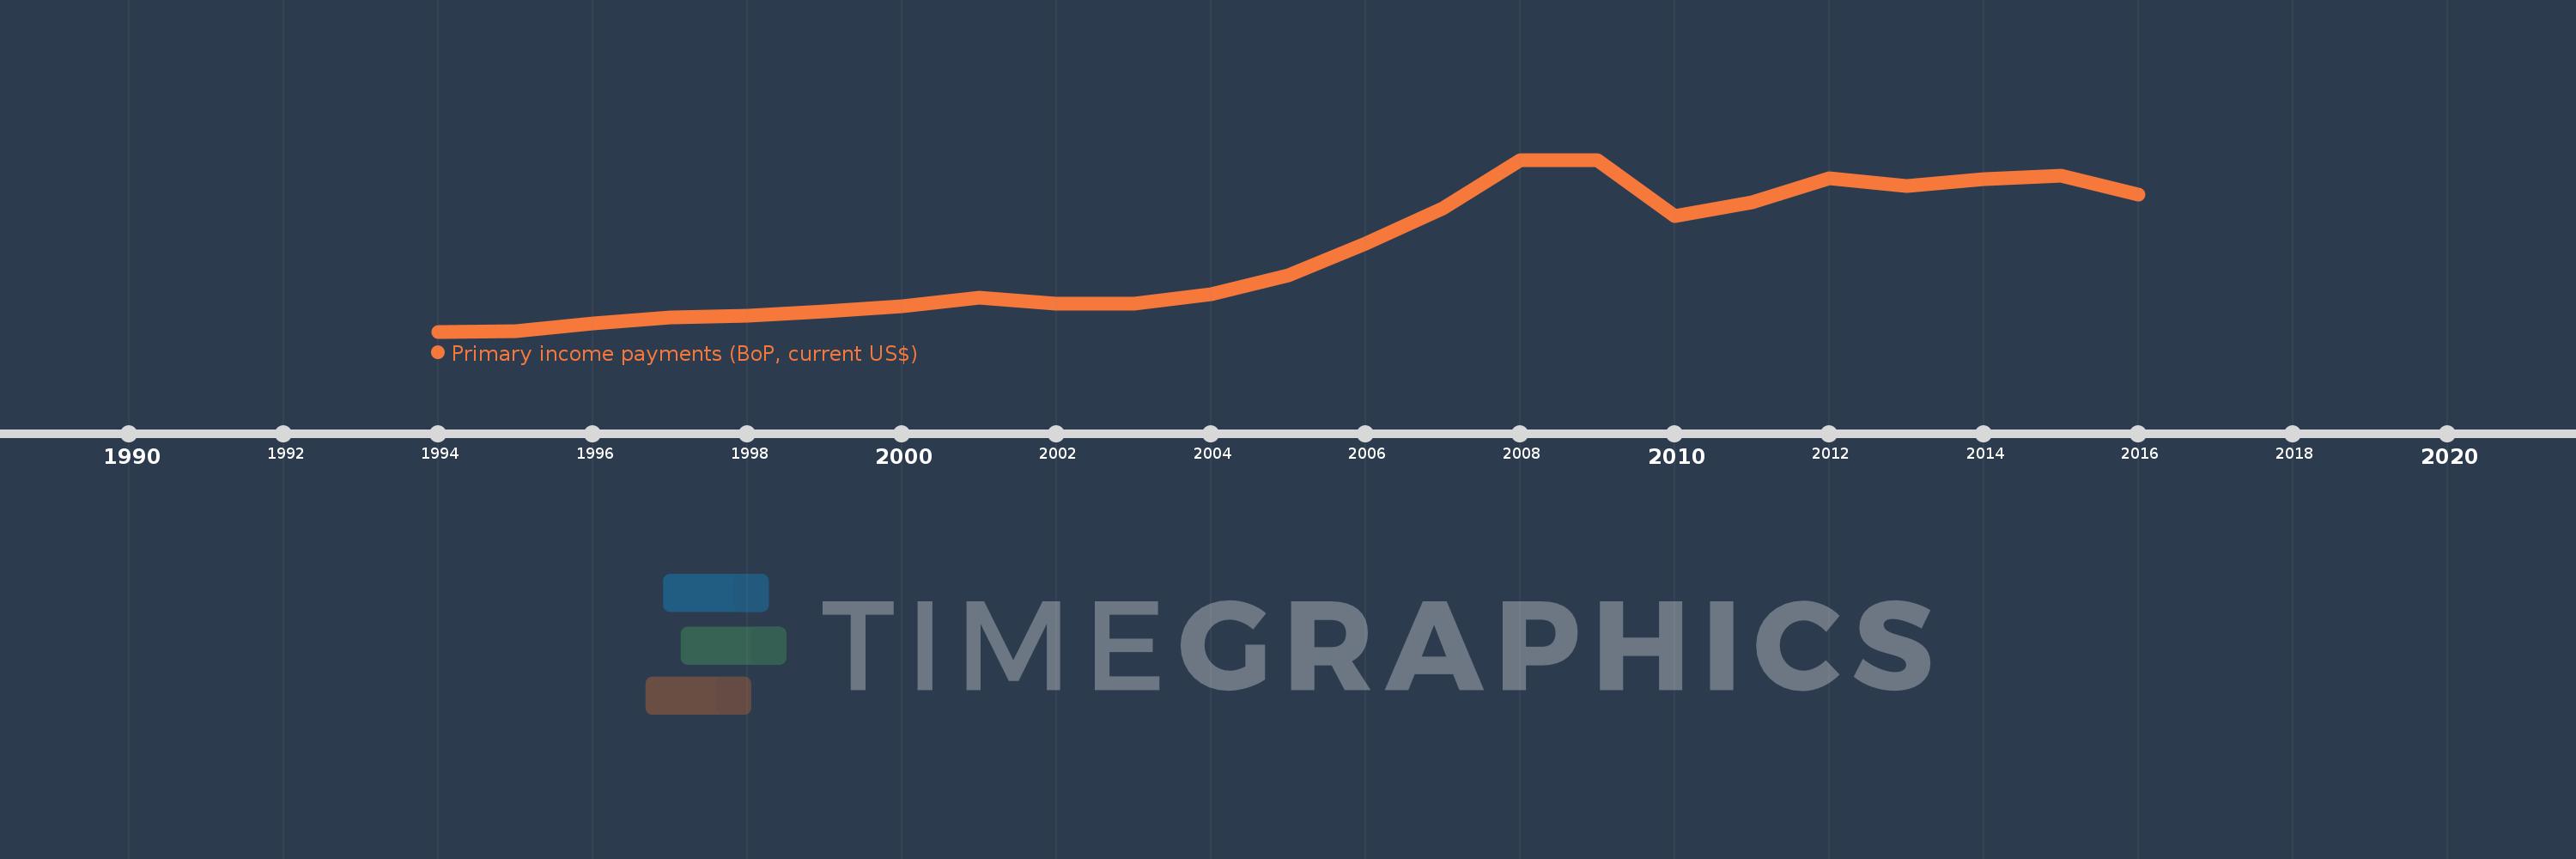
Diese Zeitleiste vorliegt die Graphik ab 1994 J. bis 2016 J. World. Die Angaben bis 1993 J. sind nicht vorhanden. Die Zahl aktueller Beobachtungen nach Daten: 23.
Die Quelle (Bezeichnung):
Kennzahlen der Weltentwicklung
Die Quelle (Einrichtung):
International Monetary Fund, Balance of Payments Statistics Yearbook and data files.
Kategorien:
Economy & Growth
Es wurde aktualisiert:
23 Apr 2017 Jahr
Kennzahlen der Wertänderungen vom Jahr zum Jahr
im Durchschnitt:
2.408 Trln
Minimum:
751.702 Mlrd.
1 Jan 1994 Jahr
Maximum:
4.369 Trln
1 Jan 2009 Jahr
Zum Datum der Beobachtung
Wert
Absolute Veränderung
Die Veränderung bezüglich dem vorherigen Wert
1 Jan 1994 Jahr
751.702 Mlrd.
+751.702 Mlrd.
0.0%
1 Jan 1995 Jahr
759.174 Mlrd.
+7.473 Mlrd.
0.99%
1 Jan 1996 Jahr
928.295 Mlrd.
+169.12 Mlrd.
22.28%
1 Jan 1997 Jahr
1.042 Trln
+113.93 Mlrd.
12.27%
1 Jan 1998 Jahr
1.084 Trln
+41.858 Mlrd.
4.02%
1 Jan 1999 Jahr
1.174 Trln
+90.375 Mlrd.
8.34%
1 Jan 2000 Jahr
1.292 Trln
+117.065 Mlrd.
9.97%
1 Jan 2001 Jahr
1.459 Trln
+167.34 Mlrd.
12.96%
1 Jan 2002 Jahr
1.339 Trln
-120.05 Mlrd.
-8.23%
1 Jan 2003 Jahr
1.337 Trln
-2.138 Mlrd.
-0.16%
1 Jan 2004 Jahr
1.534 Trln
+197.631 Mlrd.
14.79%
1 Jan 2005 Jahr
1.932 Trln
+397.634 Mlrd.
25.92%
1 Jan 2006 Jahr
2.598 Trln
+665.964 Mlrd.
34.47%
1 Jan 2007 Jahr
3.34 Trln
+741.974 Mlrd.
28.56%
1 Jan 2008 Jahr
4.36 Trln
+1.02 Trln
30.54%
1 Jan 2009 Jahr
4.369 Trln
+9.019 Mlrd.
0.21%
1 Jan 2010 Jahr
3.191 Trln
-1.178 Trln
-26.96%
1 Jan 2011 Jahr
3.477 Trln
+286.247 Mlrd.
8.97%
1 Jan 2012 Jahr
3.974 Trln
+496.367 Mlrd.
14.28%
1 Jan 2013 Jahr
3.814 Trln
-159.976 Mlrd.
-4.03%
1 Jan 2014 Jahr
3.959 Trln
+145.509 Mlrd.
3.82%
1 Jan 2015 Jahr
4.027 Trln
+68.348 Mlrd.
1.73%
1 Jan 2016 Jahr
3.643 Trln
-384.856 Mlrd.
-9.56%
Bewertung der Länder gemäß mit laufender Statistik nach Jahren

Kommentare:

Abschicken
PremiumAbout & FeedbackVereinbarungPrivatheit
logo
© 2022 Selected Technologies LLC – Morgan Hill, California