33
/de/
AIzaSyAYiBZKx7MnpbEhh9jyipgxe19OcubqV5w
August 1, 2025
62777
World
WLD
false
2
1
Manufacturing, value added (current US$)
2015,2014,2013,2012,2011,2010,2009,2008,2007,2006,2005,2004,2003,2002,2001,2000,1999,1998,1997,1996,1995,1994,1993,1992
Download
Bibliothek der Globalstatistik →World →

Manufacturing, value added (current US$)

Diese Statistik in anderen Ländern:

AfghanistanAlbaniaAlgeriaAndorraAngolaAntigua and BarbudaArab WorldArgentinaArmeniaArubaAustraliaAustriaAzerbaijanBahamas, TheBahrainBangladeshBarbadosBelarusBelgiumBelizeBeninBermudaBhutanBoliviaBosnia and HerzegovinaBotswanaBrazilBrunei DarussalamBurkina FasoBurundiCabo VerdeCambodiaCameroonCanadaCaribbean small statesCayman IslandsCentral African RepublicCentral Europe and the BalticsChadChileChinaColombiaComorosCongo, Dem. Rep.Congo, Rep.Costa RicaCote d'IvoireCroatiaCubaCyprusCzech RepublicDenmarkDjiboutiDominicaDominican RepublicEarly-demographic dividendEast Asia & PacificEast Asia & Pacific (excluding high income)East Asia & Pacific (IDA & IBRD countries)EcuadorEgypt, Arab Rep.El SalvadorEquatorial GuineaEritreaEstoniaEthiopiaEuro areaEurope & Central AsiaEurope & Central Asia (excluding high income)Europe & Central Asia (IDA & IBRD countries)European UnionFaroe IslandsFijiFinlandFragile and conflict affected situationsFranceGabonGambia, TheGeorgiaGermanyGhanaGreeceGrenadaGuatemalaGuineaGuinea-BissauGuyanaHeavily indebted poor countries (HIPC)High incomeHondurasHong Kong SAR, ChinaHungaryIBRD onlyIcelandIDA & IBRD totalIDA blendIDA onlyIDA totalIndiaIndonesiaIran, Islamic Rep.IraqIrelandItalyJamaicaJapanJordanKazakhstanKenyaKiribatiKorea, Rep.KosovoKuwaitKyrgyz RepublicLao PDRLate-demographic dividendLatin America & Caribbean Latin America & Caribbean (excluding high income)Latin America & the Caribbean (IDA & IBRD countries)LatviaLeast developed countries: UN classificationLebanonLesothoLiberiaLibyaLithuaniaLow & middle incomeLow incomeLower middle incomeLuxembourgMacao SAR, ChinaMacedonia, FYRMadagascarMalawiMalaysiaMaldivesMaliMaltaMarshall IslandsMauritaniaMauritiusMexicoMicronesia, Fed. Sts.Middle East & North AfricaMiddle East & North Africa (excluding high income)Middle East & North Africa (IDA & IBRD countries)Middle incomeMoldovaMongoliaMontenegroMoroccoMozambiqueMyanmarNamibiaNepalNetherlandsNew CaledoniaNew ZealandNicaraguaNigerNigeriaNorth AmericaNorwayOECD membersOmanOther small statesPacific island small statesPakistanPalauPanamaPapua New GuineaParaguayPeruPhilippinesPolandPortugalPost-demographic dividendPre-demographic dividendPuerto RicoQatarRomaniaRussian FederationRwandaSamoaSao Tome and PrincipeSaudi ArabiaSenegalSerbiaSeychellesSierra LeoneSingaporeSlovak RepublicSloveniaSmall statesSolomon IslandsSouth AfricaSouth AsiaSouth Asia (IDA & IBRD)SpainSri LankaSt. Kitts and NevisSt. LuciaSt. Vincent and the GrenadinesSub-Saharan Africa Sub-Saharan Africa (excluding high income)Sub-Saharan Africa (IDA & IBRD countries)SudanSurinameSwazilandSwedenSwitzerlandSyrian Arab RepublicTajikistanTanzaniaThailandTimor-LesteTogoTongaTrinidad and TobagoTunisiaTurkeyTurkmenistanTuvaluUgandaUkraineUnited Arab EmiratesUnited KingdomUnited StatesUpper middle incomeUruguayUzbekistanVanuatuVenezuela, RBVietnamWest Bank and GazaWorldYemen, Rep.ZambiaZimbabwe

Zeitlinie:

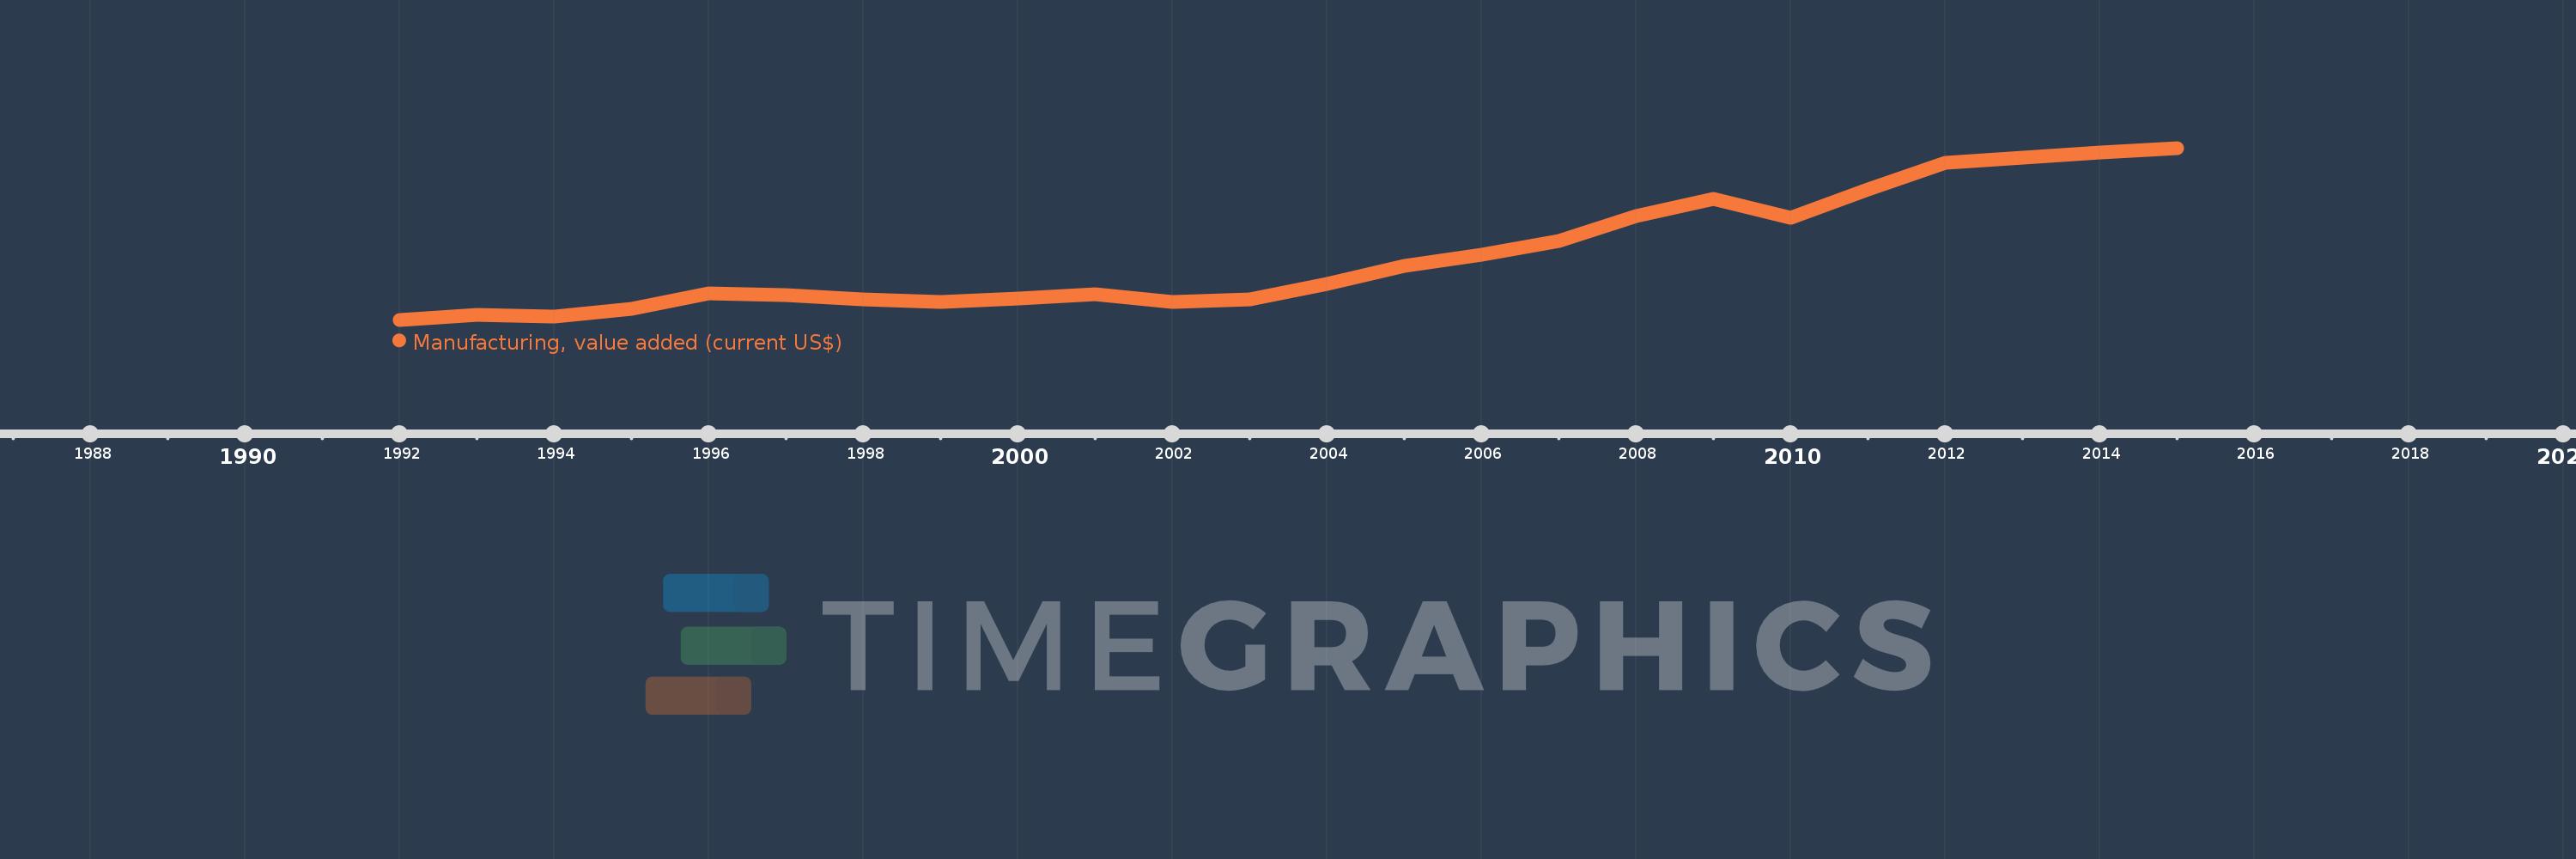
Diese Zeitleiste vorliegt die Graphik ab 1992 J. bis 2015 J. World. Die Angaben bis 1991 J. sind nicht vorhanden. Die Zahl aktueller Beobachtungen nach Daten: 24.

Die Quelle (Bezeichnung):

Kennzahlen der Weltentwicklung

Die Quelle (Einrichtung):

World Bank national accounts data, and OECD National Accounts data files.

Kategorien:

Economy & Growth

Es wurde aktualisiert:

23 Apr 2017 Jahr

Kennzahlen der Wertänderungen vom Jahr zum Jahr

im Durchschnitt:
7.496 Trln
Minimum:
4.719 Trln
1 Jan 1992 Jahr
Maximum:
12.143 Trln
1 Jan 2015 Jahr
Zum Datum der Beobachtung
Wert
Absolute Veränderung
Die Veränderung bezüglich dem vorherigen Wert
1 Jan 1992 Jahr
4.719 Trln
+4.719 Trln
0.0%
1 Jan 1993 Jahr
4.919 Trln
+200.047 Mlrd.
4.24%
1 Jan 1994 Jahr
4.846 Trln
-72.972 Mlrd.
-1.48%
1 Jan 1995 Jahr
5.199 Trln
+353.271 Mlrd.
7.29%
1 Jan 1996 Jahr
5.857 Trln
+658.6 Mlrd.
12.67%
1 Jan 1997 Jahr
5.792 Trln
-65.717 Mlrd.
-1.12%
1 Jan 1998 Jahr
5.61 Trln
-181.694 Mlrd.
-3.14%
1 Jan 1999 Jahr
5.502 Trln
-107.636 Mlrd.
-1.92%
1 Jan 2000 Jahr
5.65 Trln
+147.851 Mlrd.
2.69%
1 Jan 2001 Jahr
5.811 Trln
+161.018 Mlrd.
2.85%
1 Jan 2002 Jahr
5.504 Trln
-307.744 Mlrd.
-5.3%
1 Jan 2003 Jahr
5.595 Trln
+91.74 Mlrd.
1.67%
1 Jan 2004 Jahr
6.263 Trln
+668.068 Mlrd.
11.94%
1 Jan 2005 Jahr
7.032 Trln
+768.201 Mlrd.
12.27%
1 Jan 2006 Jahr
7.518 Trln
+486.761 Mlrd.
6.92%
1 Jan 2007 Jahr
8.138 Trln
+620.059 Mlrd.
8.25%
1 Jan 2008 Jahr
9.198 Trln
+1.06 Trln
13.02%
1 Jan 2009 Jahr
9.94 Trln
+741.926 Mlrd.
8.07%
1 Jan 2010 Jahr
9.123 Trln
-817.048 Mlrd.
-8.22%
1 Jan 2011 Jahr
10.346 Trln
+1.223 Trln
13.41%
1 Jan 2012 Jahr
11.507 Trln
+1.161 Trln
11.22%
1 Jan 2013 Jahr
11.718 Trln
+211.107 Mlrd.
1.83%
1 Jan 2014 Jahr
11.963 Trln
+245.11 Mlrd.
2.09%
1 Jan 2015 Jahr
12.143 Trln
+179.926 Mlrd.
1.5%

Bewertung der Länder gemäß mit laufender Statistik nach Jahren