29
/de/
de
AIzaSyAYiBZKx7MnpbEhh9jyipgxe19OcubqV5w
April 1, 2024
58630
South Asia (IDA & IBRD)
TSA
false
2
1
Unemployment with tertiary education (% of total unemployment)
2011,2006,2005,2004,2003,2002,2001,2000,1999,1998,1997,1996,1995,1994,1993,1992
Download
Bibliothek der Globalstatistik →South Asia (IDA & IBRD) →

Unemployment with tertiary education (% of total unemployment)

Diese Statistik in anderen Ländern:
AlbaniaAlgeriaArgentinaArmeniaArubaAustraliaAustriaAzerbaijanBahamas, TheBahrainBangladeshBarbadosBelarusBelgiumBelizeBermudaBhutanBoliviaBosnia and HerzegovinaBotswanaBrazilBritish Virgin IslandsBrunei DarussalamBulgariaBurkina FasoCanadaCaribbean small statesCayman IslandsCentral African RepublicCentral Europe and the BalticsChadChileColombiaCosta RicaCroatiaCubaCyprusCzech RepublicDenmarkDominicaDominican RepublicEarly-demographic dividendEcuadorEgypt, Arab Rep.El SalvadorEstoniaEthiopiaEuro areaEurope & Central AsiaEurope & Central Asia (excluding high income)Europe & Central Asia (IDA & IBRD countries)European UnionFijiFinlandFranceFrench PolynesiaGabonGeorgiaGermanyGreeceGuatemalaHigh incomeHondurasHong Kong SAR, ChinaHungaryIcelandIndiaIndonesiaIran, Islamic Rep.IrelandIsraelItalyJamaicaJapanJordanKazakhstanKorea, Rep.KosovoKuwaitKyrgyz RepublicLatin America & Caribbean Latin America & Caribbean (excluding high income)Latin America & the Caribbean (IDA & IBRD countries)LatviaLebanonLesothoLithuaniaLower middle incomeLuxembourgMacao SAR, ChinaMacedonia, FYRMadagascarMalaysiaMaltaMauritiusMexicoMiddle East & North AfricaMiddle East & North Africa (excluding high income)Middle East & North Africa (IDA & IBRD countries)MoldovaMongoliaMontenegroMoroccoNamibiaNetherlandsNew CaledoniaNew ZealandNicaraguaNorth AmericaNorwayOECD membersOmanPakistanPanamaParaguayPeruPhilippinesPolandPortugalPost-demographic dividendQatarRomaniaRussian FederationRwandaSan MarinoSaudi ArabiaSenegalSerbiaSingaporeSlovak RepublicSloveniaSouth AfricaSouth AsiaSouth Asia (IDA & IBRD)SpainSri LankaSt. LuciaSt. Vincent and the GrenadinesSurinameSwedenSwitzerlandSyrian Arab RepublicTajikistanTanzaniaThailandTimor-LesteTongaTrinidad and TobagoTunisiaTurkeyUkraineUnited Arab EmiratesUnited KingdomUnited StatesUruguayVenezuela, RBWest Bank and GazaZimbabwe
Zeitlinie:
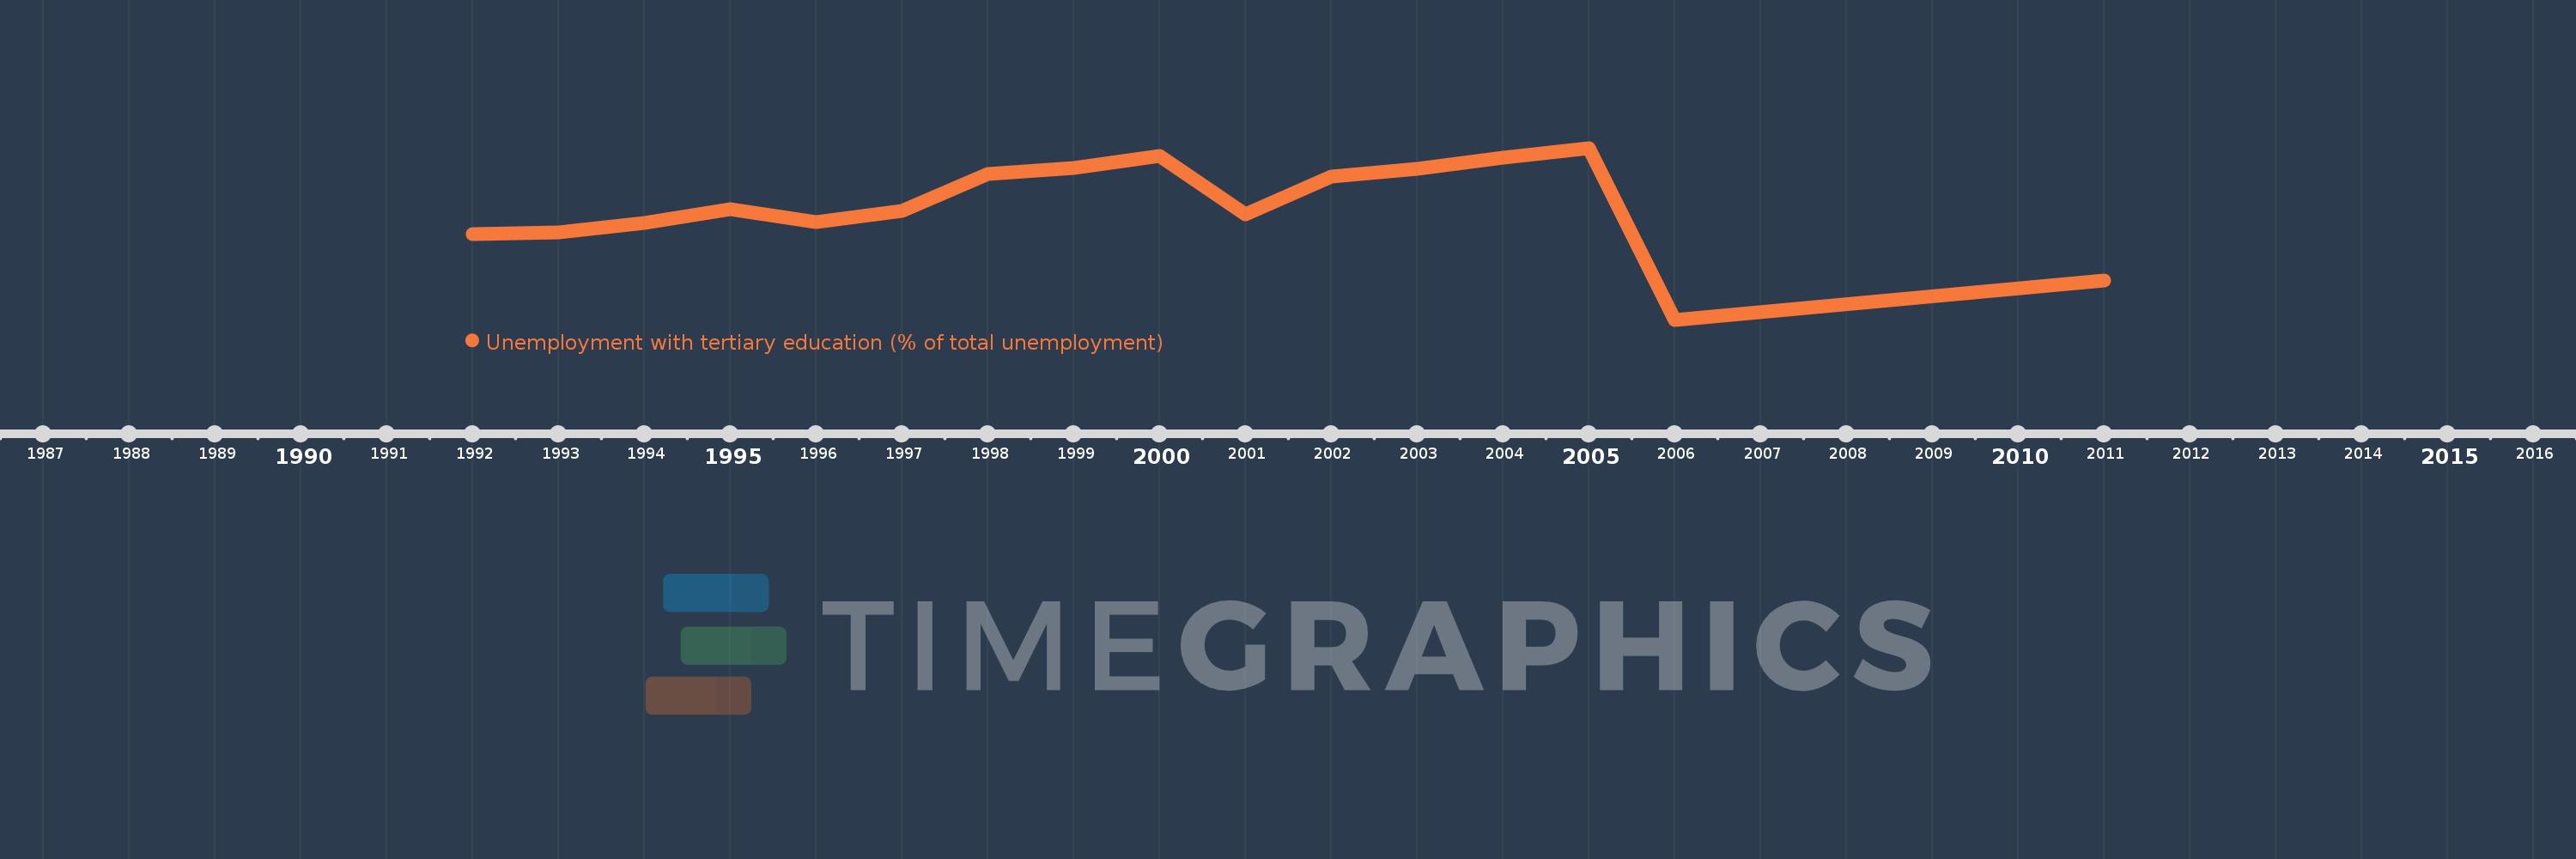
Diese Zeitleiste vorliegt die Graphik ab 1992 J. bis 2011 J. South Asia (IDA & IBRD). Die Angaben bis 1991 J. sind nicht vorhanden. Die Zahl aktueller Beobachtungen nach Daten: 16.
Die Quelle (Bezeichnung):
Kennzahlen der Weltentwicklung
Die Quelle (Einrichtung):
International Labour Organization, Key Indicators of the Labour Market database.
Kategorien:
Social Protection & Labor
Es wurde aktualisiert:
23 Apr 2017 Jahr
Kennzahlen der Wertänderungen vom Jahr zum Jahr
im Durchschnitt:
27.487
Minimum:
20.228
1 Jan 2006 Jahr
Maximum:
31.186
1 Jan 2005 Jahr
Zum Datum der Beobachtung
Wert
Absolute Veränderung
Die Veränderung bezüglich dem vorherigen Wert
1 Jan 1992 Jahr
25.7
+25.7
0.0%
1 Jan 1993 Jahr
25.8
+0.1
0.39%
1 Jan 1994 Jahr
26.4
+0.6
2.33%
1 Jan 1995 Jahr
27.3
+0.9
3.41%
1 Jan 1996 Jahr
26.448
-0.852
-3.12%
1 Jan 1997 Jahr
27.166
+0.718
2.72%
1 Jan 1998 Jahr
29.5
+2.334
8.59%
1 Jan 1999 Jahr
29.9
+0.4
1.36%
1 Jan 2000 Jahr
30.7
+0.8
2.68%
1 Jan 2001 Jahr
26.963
-3.737
-12.17%
1 Jan 2002 Jahr
29.352
+2.388
8.86%
1 Jan 2003 Jahr
29.839
+0.487
1.66%
1 Jan 2004 Jahr
30.581
+0.742
2.49%
1 Jan 2005 Jahr
31.186
+0.606
1.98%
1 Jan 2006 Jahr
20.228
-10.959
-35.14%
1 Jan 2011 Jahr
22.729
+2.501
12.36%
Bewertung der Länder gemäß mit laufender Statistik nach Jahren

Kommentare:

Abschicken
PremiumAbout & FeedbackVereinbarungPrivatheit
logo
© 2022 Selected Technologies LLC – Morgan Hill, California