30
/de/
AIzaSyAYiBZKx7MnpbEhh9jyipgxe19OcubqV5w
April 1, 2024
52970
OECD members
OED
false
2
1
Prevalence of anemia among women of reproductive age (% of women ages 15-49)
2012,2011,2010,2009,2008,2007,2006,2005,2004,2003,2002,2001,2000,1999,1998,1997,1996
Download
Bibliothek der Globalstatistik →OECD members →

Prevalence of anemia among women of reproductive age (% of women ages 15-49)

Diese Statistik in anderen Ländern:

AfghanistanAlbaniaAlgeriaAndorraAngolaAntigua and BarbudaArab WorldArgentinaArmeniaAustraliaAustriaAzerbaijanBahamas, TheBahrainBangladeshBarbadosBelarusBelgiumBelizeBeninBhutanBoliviaBosnia and HerzegovinaBotswanaBrazilBrunei DarussalamBulgariaBurkina FasoBurundiCabo VerdeCambodiaCameroonCanadaCaribbean small statesCentral African RepublicCentral Europe and the BalticsChadChileChinaColombiaComorosCongo, Dem. Rep.Congo, Rep.Costa RicaCote d'IvoireCroatiaCubaCyprusCzech RepublicDenmarkDjiboutiDominicaDominican RepublicEarly-demographic dividendEast Asia & PacificEast Asia & Pacific (excluding high income)East Asia & Pacific (IDA & IBRD countries)EcuadorEgypt, Arab Rep.El SalvadorEquatorial GuineaEritreaEstoniaEthiopiaEuro areaEurope & Central AsiaEurope & Central Asia (excluding high income)Europe & Central Asia (IDA & IBRD countries)European UnionFijiFinlandFragile and conflict affected situationsFranceGabonGambia, TheGeorgiaGermanyGhanaGreeceGrenadaGuatemalaGuineaGuinea-BissauGuyanaHaitiHeavily indebted poor countries (HIPC)High incomeHondurasHong Kong SAR, ChinaHungaryIBRD onlyIcelandIDA & IBRD totalIDA blendIDA onlyIDA totalIndiaIndonesiaIran, Islamic Rep.IraqIrelandIsraelItalyJamaicaJapanJordanKazakhstanKenyaKiribatiKorea, Dem. People’s Rep.Korea, Rep.KuwaitKyrgyz RepublicLao PDRLate-demographic dividendLatin America & Caribbean Latin America & Caribbean (excluding high income)Latin America & the Caribbean (IDA & IBRD countries)LatviaLeast developed countries: UN classificationLebanonLesothoLiberiaLibyaLithuaniaLow & middle incomeLow incomeLower middle incomeLuxembourgMacao SAR, ChinaMacedonia, FYRMadagascarMalawiMalaysiaMaldivesMaliMaltaMarshall IslandsMauritaniaMauritiusMexicoMicronesia, Fed. Sts.Middle East & North AfricaMiddle East & North Africa (excluding high income)Middle East & North Africa (IDA & IBRD countries)Middle incomeMoldovaMongoliaMontenegroMoroccoMozambiqueMyanmarNamibiaNepalNetherlandsNew ZealandNicaraguaNigerNigeriaNorth AmericaNorwayOECD membersOmanOther small statesPacific island small statesPakistanPanamaPapua New GuineaParaguayPeruPhilippinesPolandPortugalPost-demographic dividendPre-demographic dividendPuerto RicoQatarRomaniaRussian FederationRwandaSamoaSao Tome and PrincipeSaudi ArabiaSenegalSerbiaSeychellesSierra LeoneSingaporeSlovak RepublicSloveniaSmall statesSolomon IslandsSomaliaSouth AfricaSouth AsiaSouth Asia (IDA & IBRD)SpainSri LankaSt. LuciaSt. Vincent and the GrenadinesSub-Saharan Africa Sub-Saharan Africa (excluding high income)Sub-Saharan Africa (IDA & IBRD countries)SudanSurinameSwazilandSwedenSwitzerlandSyrian Arab RepublicTajikistanTanzaniaThailandTimor-LesteTogoTongaTrinidad and TobagoTunisiaTurkeyTurkmenistanUgandaUkraineUnited Arab EmiratesUnited KingdomUnited StatesUpper middle incomeUruguayUzbekistanVanuatuVenezuela, RBVietnamWest Bank and GazaWorldYemen, Rep.ZambiaZimbabwe

Zeitlinie:

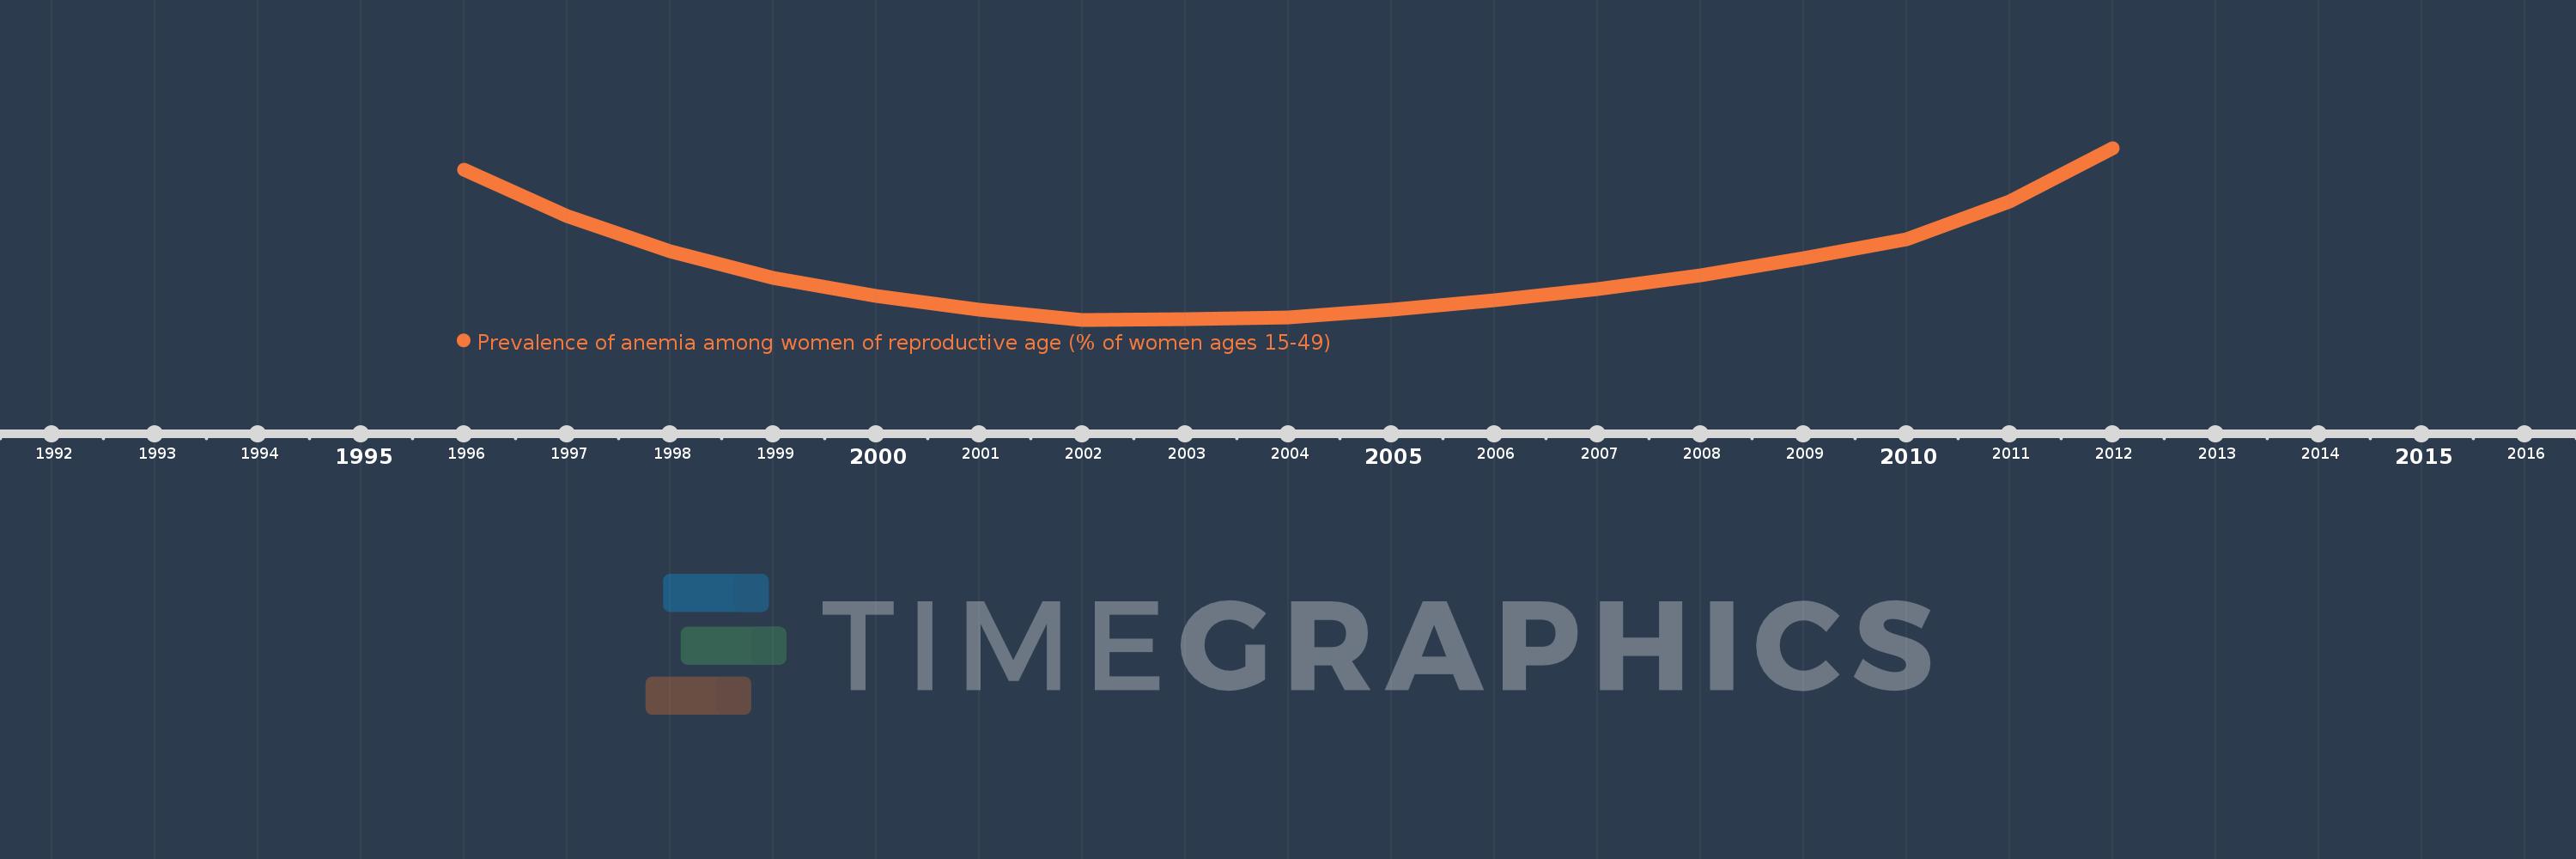
Diese Zeitleiste vorliegt die Graphik ab 1996 J. bis 2012 J. OECD members. Die Angaben bis 1995 J. sind nicht vorhanden. Die Zahl aktueller Beobachtungen nach Daten: 17.

Die Quelle (Bezeichnung):

Kennzahlen der Weltentwicklung

Die Quelle (Einrichtung):

Stevens GA et al. Global, regional, and national trends in hemoglobin concentration and prevalence of total and severe anemia in children and pregnant and non-pregnant women for 1995-2011: a systematic analysis of population-representative data. The Lancet Global Health 2013;1:e16-e25.

Kategorien:

Health

Es wurde aktualisiert:

23 Apr 2017 Jahr

Kennzahlen der Wertänderungen vom Jahr zum Jahr

im Durchschnitt:
16.132
Minimum:
15.547
1 Jan 2002 Jahr
Maximum:
17.367
1 Jan 2012 Jahr
Zum Datum der Beobachtung
Wert
Absolute Veränderung
Die Veränderung bezüglich dem vorherigen Wert
1 Jan 1996 Jahr
17.135
+17.135
0.0%
1 Jan 1997 Jahr
16.648
-0.487
-2.84%
1 Jan 1998 Jahr
16.273
-0.375
-2.25%
1 Jan 1999 Jahr
15.99
-0.283
-1.74%
1 Jan 2000 Jahr
15.796
-0.194
-1.21%
1 Jan 2001 Jahr
15.653
-0.143
-0.9%
1 Jan 2002 Jahr
15.547
-0.106
-0.68%
1 Jan 2003 Jahr
15.557
+0.01
0.07%
1 Jan 2004 Jahr
15.576
+0.019
0.12%
1 Jan 2005 Jahr
15.652
+0.075
0.48%
1 Jan 2006 Jahr
15.756
+0.104
0.66%
1 Jan 2007 Jahr
15.871
+0.115
0.73%
1 Jan 2008 Jahr
16.019
+0.148
0.93%
1 Jan 2009 Jahr
16.199
+0.179
1.12%
1 Jan 2010 Jahr
16.404
+0.205
1.27%
1 Jan 2011 Jahr
16.796
+0.393
2.39%
1 Jan 2012 Jahr
17.367
+0.571
3.4%

Bewertung der Länder gemäß mit laufender Statistik nach Jahren