33
/de/
AIzaSyAYiBZKx7MnpbEhh9jyipgxe19OcubqV5w
August 1, 2025
52757
OECD members
OED
false
2
1
Labor force with tertiary education (% of total)
2015,2014,2013,2012,2011,2010,2009,2008,2007,2006,2004,2003,2002,2001,2000,1999,1998
Download
Bibliothek der Globalstatistik →OECD members →

Labor force with tertiary education (% of total)

Diese Statistik in anderen Ländern:

AlbaniaAlgeriaAntigua and BarbudaArgentinaArmeniaArubaAustraliaAustriaAzerbaijanBahamas, TheBahrainBarbadosBelarusBelgiumBelizeBermudaBoliviaBosnia and HerzegovinaBotswanaBrazilBritish Virgin IslandsBulgariaCambodiaCanadaCayman IslandsCentral Europe and the BalticsChadChileColombiaCosta RicaCroatiaCubaCyprusCzech RepublicDenmarkDominicaDominican RepublicEarly-demographic dividendEcuadorEgypt, Arab Rep.El SalvadorEstoniaEthiopiaEuro areaEurope & Central AsiaEurope & Central Asia (excluding high income)Europe & Central Asia (IDA & IBRD countries)European UnionFinlandFranceFrench PolynesiaGeorgiaGermanyGhanaGreeceGuatemalaGuyanaHigh incomeHondurasHong Kong SAR, ChinaHungaryIcelandIndiaIndonesiaIran, Islamic Rep.IrelandIsraelItalyJapanJordanKazakhstanKorea, Rep.KosovoKuwaitKyrgyz RepublicLatin America & Caribbean Latin America & Caribbean (excluding high income)Latin America & the Caribbean (IDA & IBRD countries)LatviaLebanonLithuaniaLuxembourgMacao SAR, ChinaMacedonia, FYRMadagascarMalaysiaMaltaMauritiusMexicoMoldovaMongoliaMontenegroMoroccoNamibiaNepalNetherlandsNew CaledoniaNew ZealandNicaraguaNigerNigeriaNorth AmericaNorwayOECD membersOmanPakistanPanamaParaguayPeruPhilippinesPolandPortugalPost-demographic dividendRomaniaRussian FederationRwandaSan MarinoSaudi ArabiaSerbiaSingaporeSlovak RepublicSloveniaSouth AfricaSouth AsiaSouth Asia (IDA & IBRD)SpainSri LankaSt. Kitts and NevisSt. LuciaSt. Vincent and the GrenadinesSwedenSwitzerlandSyrian Arab RepublicTajikistanThailandTimor-LesteTrinidad and TobagoTunisiaTurkeyUgandaUkraineUnited Arab EmiratesUnited KingdomUnited StatesUruguayVenezuela, RBWest Bank and GazaYemen, Rep.

Zeitlinie:

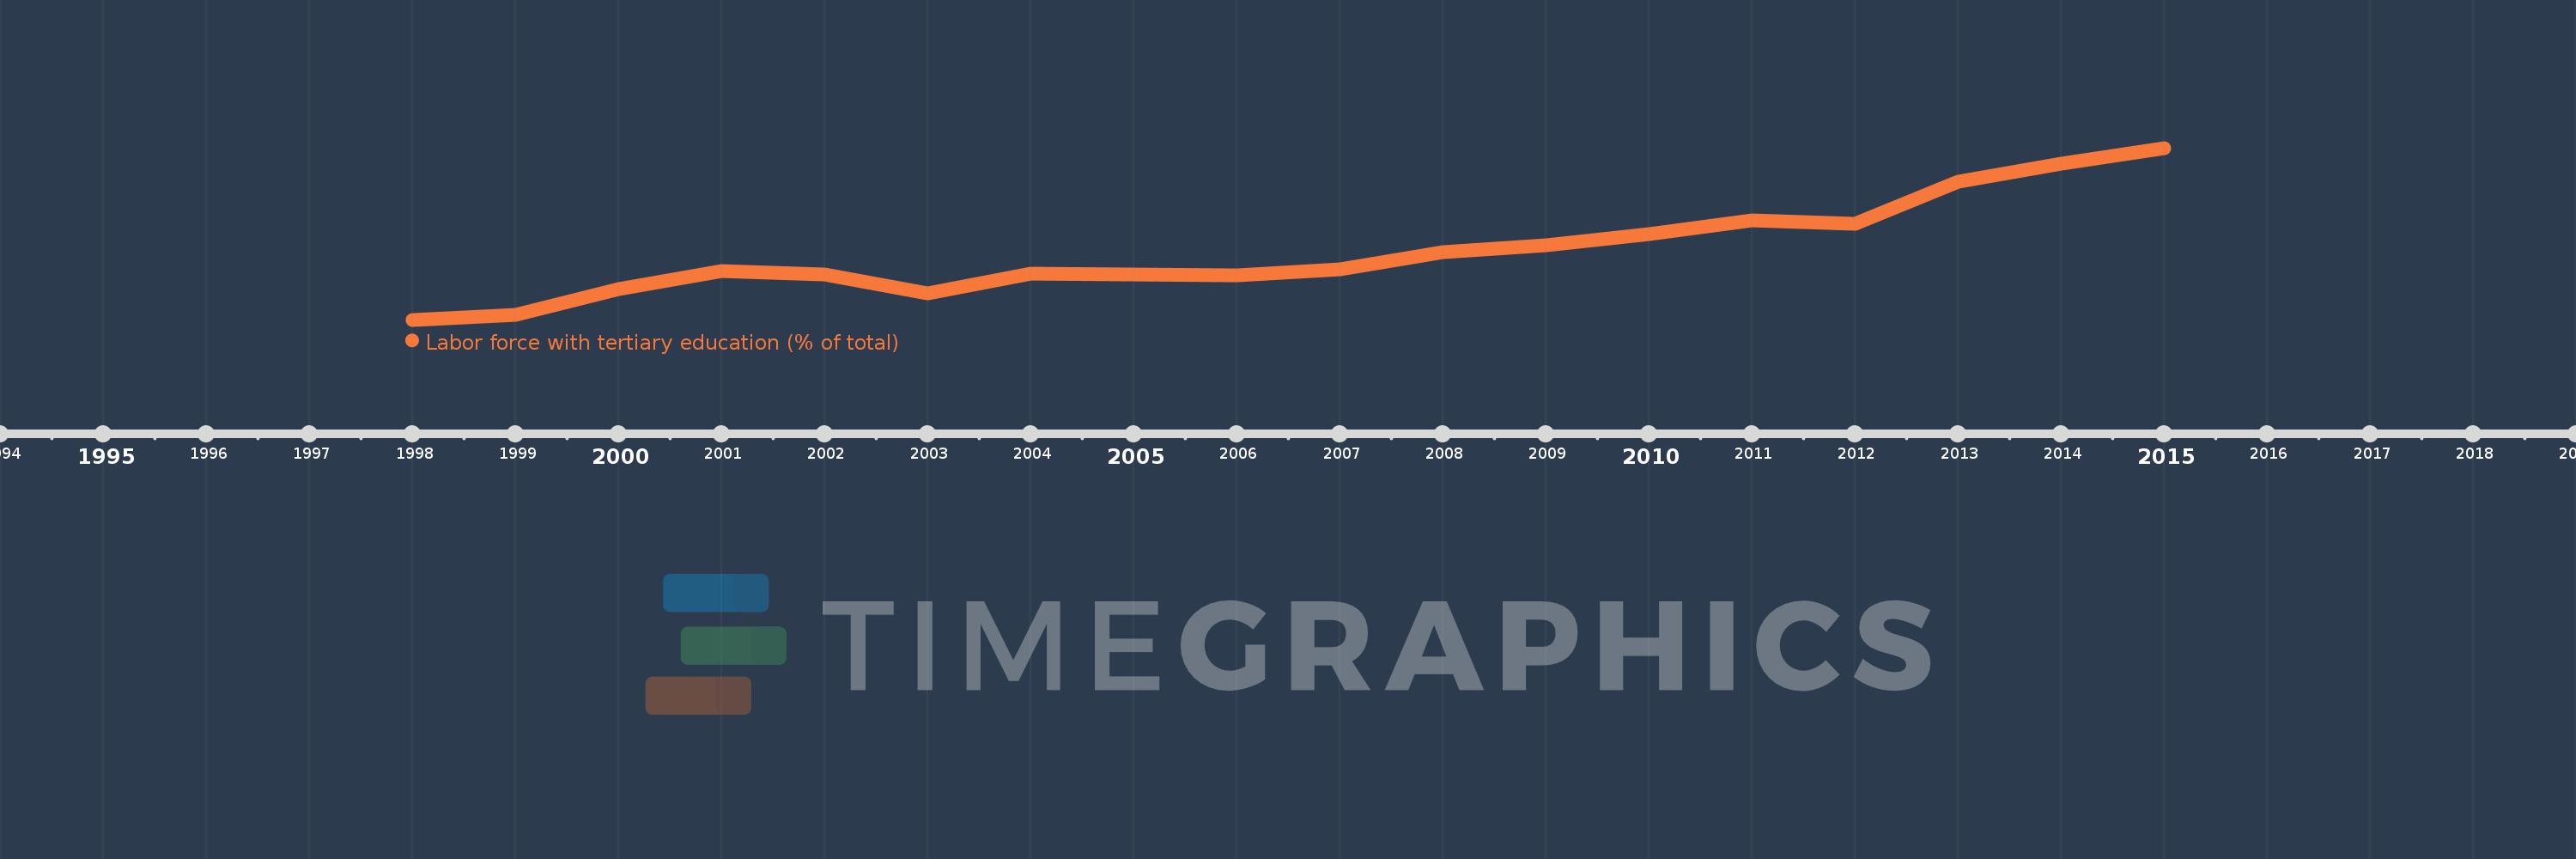
Diese Zeitleiste vorliegt die Graphik ab 1998 J. bis 2015 J. OECD members. Die Angaben bis 1997 J. sind nicht vorhanden. Die Zahl aktueller Beobachtungen nach Daten: 17.

Die Quelle (Bezeichnung):

Kennzahlen der Weltentwicklung

Die Quelle (Einrichtung):

International Labour Organization, Key Indicators of the Labour Market database.

Kategorien:

Education, Social Protection & Labor

Es wurde aktualisiert:

23 Apr 2017 Jahr

Kennzahlen der Wertänderungen vom Jahr zum Jahr

im Durchschnitt:
28.28
Minimum:
25.247
1 Jan 1998 Jahr
Maximum:
32.714
1 Jan 2015 Jahr
Zum Datum der Beobachtung
Wert
Absolute Veränderung
Die Veränderung bezüglich dem vorherigen Wert
1 Jan 1998 Jahr
25.247
+25.247
0.0%
1 Jan 1999 Jahr
25.462
+0.215
0.85%
1 Jan 2000 Jahr
26.566
+1.103
4.33%
1 Jan 2001 Jahr
27.373
+0.808
3.04%
1 Jan 2002 Jahr
27.229
-0.144
-0.53%
1 Jan 2003 Jahr
26.379
-0.851
-3.12%
1 Jan 2004 Jahr
27.249
+0.871
3.3%
1 Jan 2006 Jahr
27.175
-0.074
-0.27%
1 Jan 2007 Jahr
27.456
+0.281
1.04%
1 Jan 2008 Jahr
28.188
+0.732
2.67%
1 Jan 2009 Jahr
28.502
+0.314
1.11%
1 Jan 2010 Jahr
28.983
+0.481
1.69%
1 Jan 2011 Jahr
29.561
+0.578
2.0%
1 Jan 2012 Jahr
29.413
-0.148
-0.5%
1 Jan 2013 Jahr
31.245
+1.832
6.23%
1 Jan 2014 Jahr
32.023
+0.777
2.49%
1 Jan 2015 Jahr
32.714
+0.691
2.16%

Bewertung der Länder gemäß mit laufender Statistik nach Jahren