33
/de/
AIzaSyAYiBZKx7MnpbEhh9jyipgxe19OcubqV5w
August 1, 2025
52751
OECD members
OED
false
2
1
Labor force with primary education (% of total)
2015,2014,2013,2012,2011,2010,2009,2008,2007,2006,2004,2003,2002,2001,2000,1999,1998
Download
Bibliothek der Globalstatistik →OECD members →

Labor force with primary education (% of total)

Diese Statistik in anderen Ländern:

AlbaniaAlgeriaAntigua and BarbudaArgentinaArmeniaArubaAustraliaAustriaAzerbaijanBahamas, TheBahrainBarbadosBelarusBelgiumBelizeBermudaBoliviaBosnia and HerzegovinaBotswanaBrazilBritish Virgin IslandsBulgariaCambodiaCanadaCayman IslandsCentral Europe and the BalticsChadChileColombiaCosta RicaCroatiaCubaCyprusCzech RepublicDenmarkDominicaDominican RepublicEarly-demographic dividendEcuadorEgypt, Arab Rep.El SalvadorEstoniaEthiopiaEuro areaEurope & Central AsiaEurope & Central Asia (excluding high income)Europe & Central Asia (IDA & IBRD countries)European UnionFinlandFranceFrench PolynesiaGeorgiaGermanyGhanaGreeceGuatemalaGuyanaHigh incomeHondurasHong Kong SAR, ChinaHungaryIcelandIndiaIndonesiaIran, Islamic Rep.IrelandIsraelItalyJapanJordanKazakhstanKorea, Rep.KosovoKuwaitKyrgyz RepublicLatin America & Caribbean Latin America & Caribbean (excluding high income)Latin America & the Caribbean (IDA & IBRD countries)LatviaLebanonLithuaniaLuxembourgMacao SAR, ChinaMacedonia, FYRMadagascarMalaysiaMaltaMauritiusMexicoMoldovaMongoliaMontenegroMoroccoNamibiaNepalNetherlandsNew CaledoniaNew ZealandNicaraguaNigerNigeriaNorth AmericaNorwayOECD membersOmanPakistanPanamaParaguayPeruPhilippinesPolandPortugalPost-demographic dividendRomaniaRussian FederationRwandaSan MarinoSaudi ArabiaSerbiaSingaporeSlovak RepublicSloveniaSouth AfricaSouth AsiaSouth Asia (IDA & IBRD)SpainSri LankaSt. Kitts and NevisSt. LuciaSt. Vincent and the GrenadinesSwedenSwitzerlandSyrian Arab RepublicTajikistanThailandTimor-LesteTrinidad and TobagoTunisiaTurkeyUgandaUkraineUnited Arab EmiratesUnited KingdomUnited StatesUruguayVenezuela, RBWest Bank and GazaYemen, Rep.

Zeitlinie:

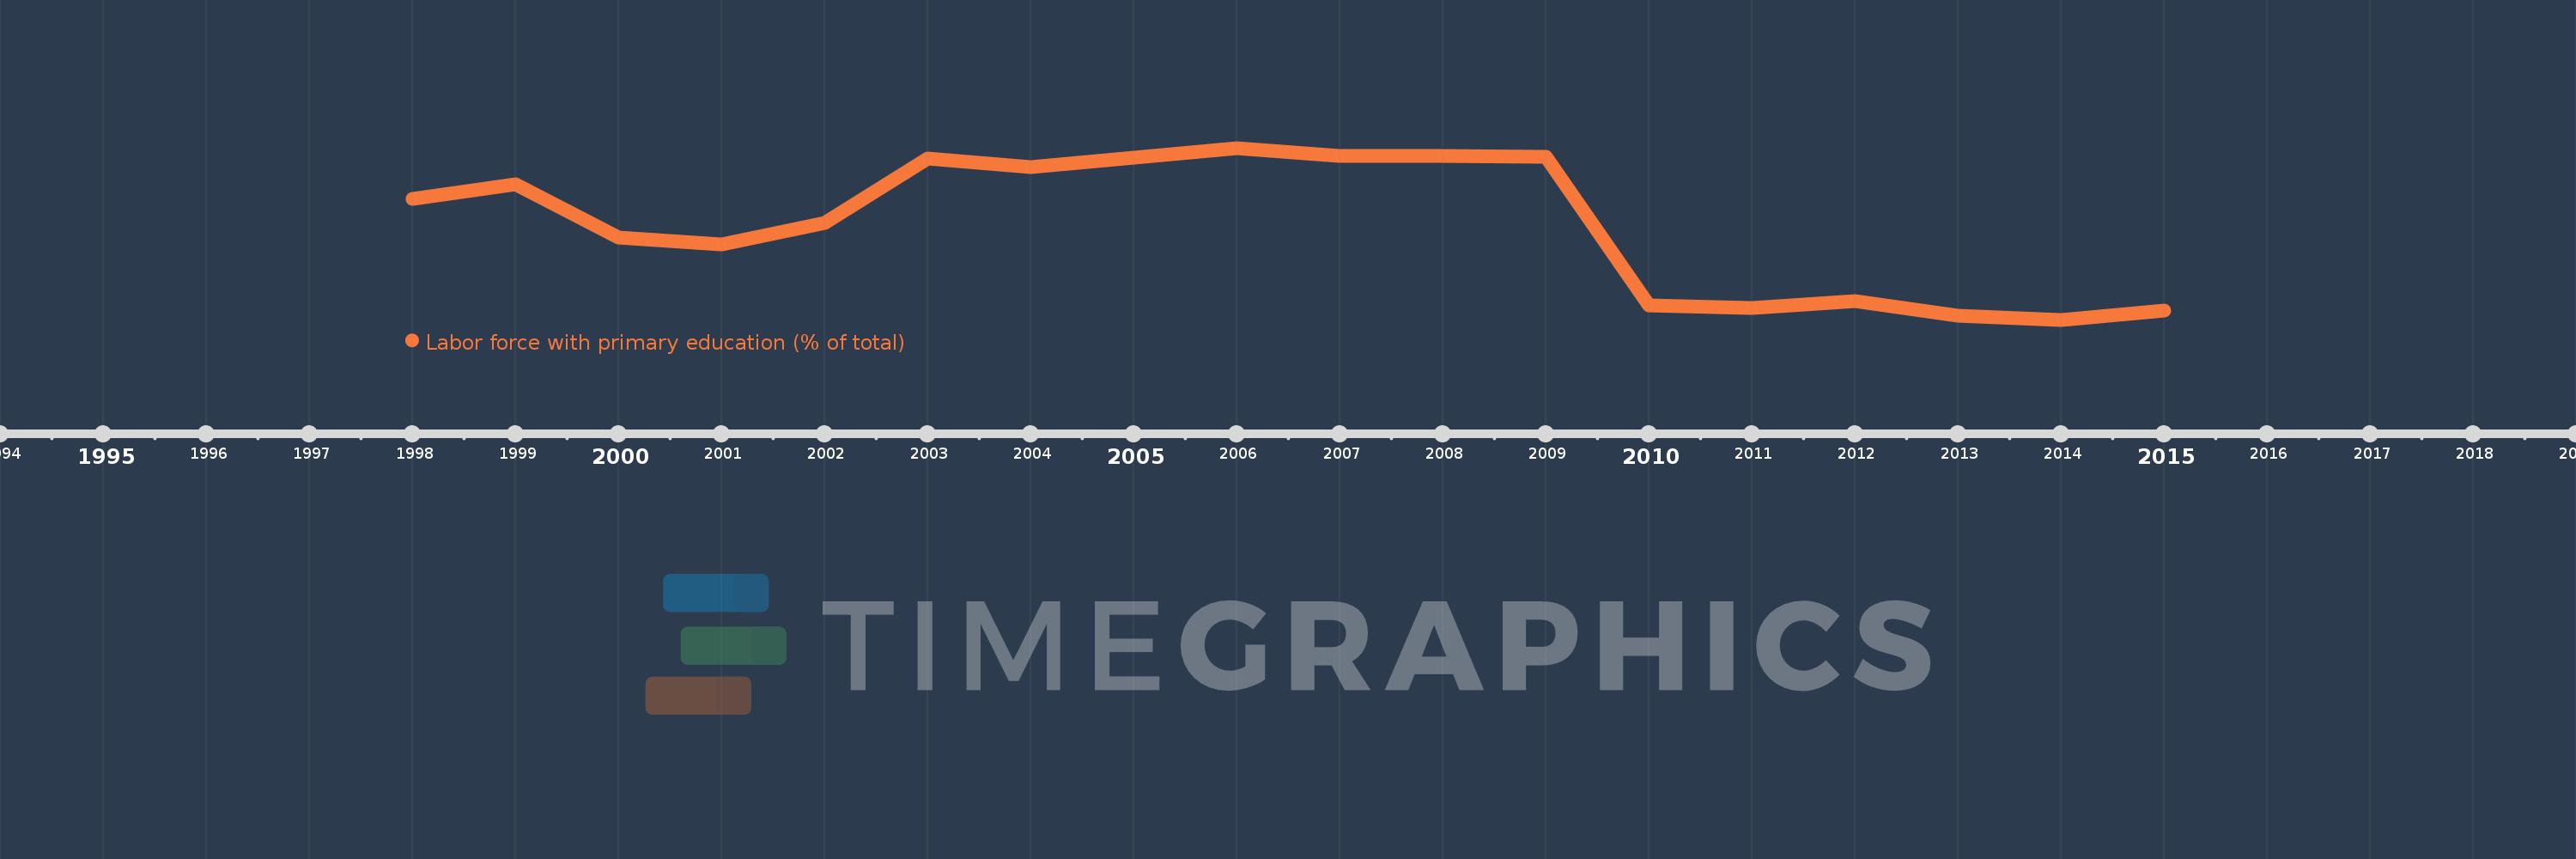
Diese Zeitleiste vorliegt die Graphik ab 1998 J. bis 2015 J. OECD members. Die Angaben bis 1997 J. sind nicht vorhanden. Die Zahl aktueller Beobachtungen nach Daten: 17.

Die Quelle (Bezeichnung):

Kennzahlen der Weltentwicklung

Die Quelle (Einrichtung):

International Labour Organization, Key Indicators of the Labour Market database.

Kategorien:

Education, Social Protection & Labor

Es wurde aktualisiert:

23 Apr 2017 Jahr

Kennzahlen der Wertänderungen vom Jahr zum Jahr

im Durchschnitt:
25.324
Minimum:
14.605
1 Jan 2014 Jahr
Maximum:
34.855
1 Jan 2006 Jahr
Zum Datum der Beobachtung
Wert
Absolute Veränderung
Die Veränderung bezüglich dem vorherigen Wert
1 Jan 1998 Jahr
28.829
+28.829
0.0%
1 Jan 1999 Jahr
30.604
+1.775
6.16%
1 Jan 2000 Jahr
24.338
-6.266
-20.47%
1 Jan 2001 Jahr
23.511
-0.827
-3.4%
1 Jan 2002 Jahr
25.988
+2.477
10.53%
1 Jan 2003 Jahr
33.574
+7.586
29.19%
1 Jan 2004 Jahr
32.614
-0.959
-2.86%
1 Jan 2006 Jahr
34.855
+2.24
6.87%
1 Jan 2007 Jahr
33.937
-0.918
-2.63%
1 Jan 2008 Jahr
33.864
-0.073
-0.22%
1 Jan 2009 Jahr
33.81
-0.054
-0.16%
1 Jan 2010 Jahr
16.323
-17.487
-51.72%
1 Jan 2011 Jahr
16.018
-0.305
-1.87%
1 Jan 2012 Jahr
16.85
+0.831
5.19%
1 Jan 2013 Jahr
15.113
-1.736
-10.3%
1 Jan 2014 Jahr
14.605
-0.509
-3.37%
1 Jan 2015 Jahr
15.673
+1.069
7.32%

Bewertung der Länder gemäß mit laufender Statistik nach Jahren