29
/de/
de
AIzaSyAYiBZKx7MnpbEhh9jyipgxe19OcubqV5w
April 1, 2024
50274
Middle East & North Africa (IDA & IBRD countries)
TMN
false
2
1
Net bilateral aid flows from DAC donors, Slovak Republic (current US$)
2015,2014,2013,2012,2010,2009,2006
Download
Bibliothek der Globalstatistik →Middle East & North Africa (IDA & IBRD countries) →

Net bilateral aid flows from DAC donors, Slovak Republic (current US$)

Diese Statistik in anderen Ländern:
AfghanistanAlbaniaAngolaArab WorldArmeniaAzerbaijanBangladeshBelarusBeninBosnia and HerzegovinaBrazilBurundiCambodiaCentral Europe and the BalticsChileChinaColombiaCosta RicaCroatiaCubaEast Asia & PacificEast Asia & Pacific (excluding high income)East Asia & Pacific (IDA & IBRD countries)EcuadorEgypt, Arab Rep.EthiopiaEurope & Central AsiaEurope & Central Asia (excluding high income)Europe & Central Asia (IDA & IBRD countries)European UnionFragile and conflict affected situationsGambia, TheGeorgiaHaitiHeavily indebted poor countries (HIPC)High incomeIBRD onlyIDA & IBRD totalIDA blendIDA onlyIDA totalIndiaIndonesiaIraqJordanKazakhstanKenyaKosovoKyrgyz RepublicLao PDRLatin America & Caribbean Latin America & Caribbean (excluding high income)Latin America & the Caribbean (IDA & IBRD countries)Least developed countries: UN classificationLebanonLesothoLiberiaLibyaLow & middle incomeLow incomeLower middle incomeMacedonia, FYRMadagascarMaliMexicoMiddle East & North AfricaMiddle East & North Africa (excluding high income)Middle East & North Africa (IDA & IBRD countries)Middle incomeMoldovaMongoliaMontenegroMozambiqueMyanmarNamibiaNepalNicaraguaOECD membersOther small statesPakistanParaguayPeruPhilippinesRwandaSerbiaSmall statesSouth AsiaSouth Asia (IDA & IBRD)South SudanSub-Saharan Africa Sub-Saharan Africa (excluding high income)Sub-Saharan Africa (IDA & IBRD countries)SudanSyrian Arab RepublicTajikistanTanzaniaThailandTunisiaTurkeyUgandaUkraineUpper middle incomeUzbekistanVietnamWest Bank and GazaWorldYemen, Rep.
Zeitlinie:
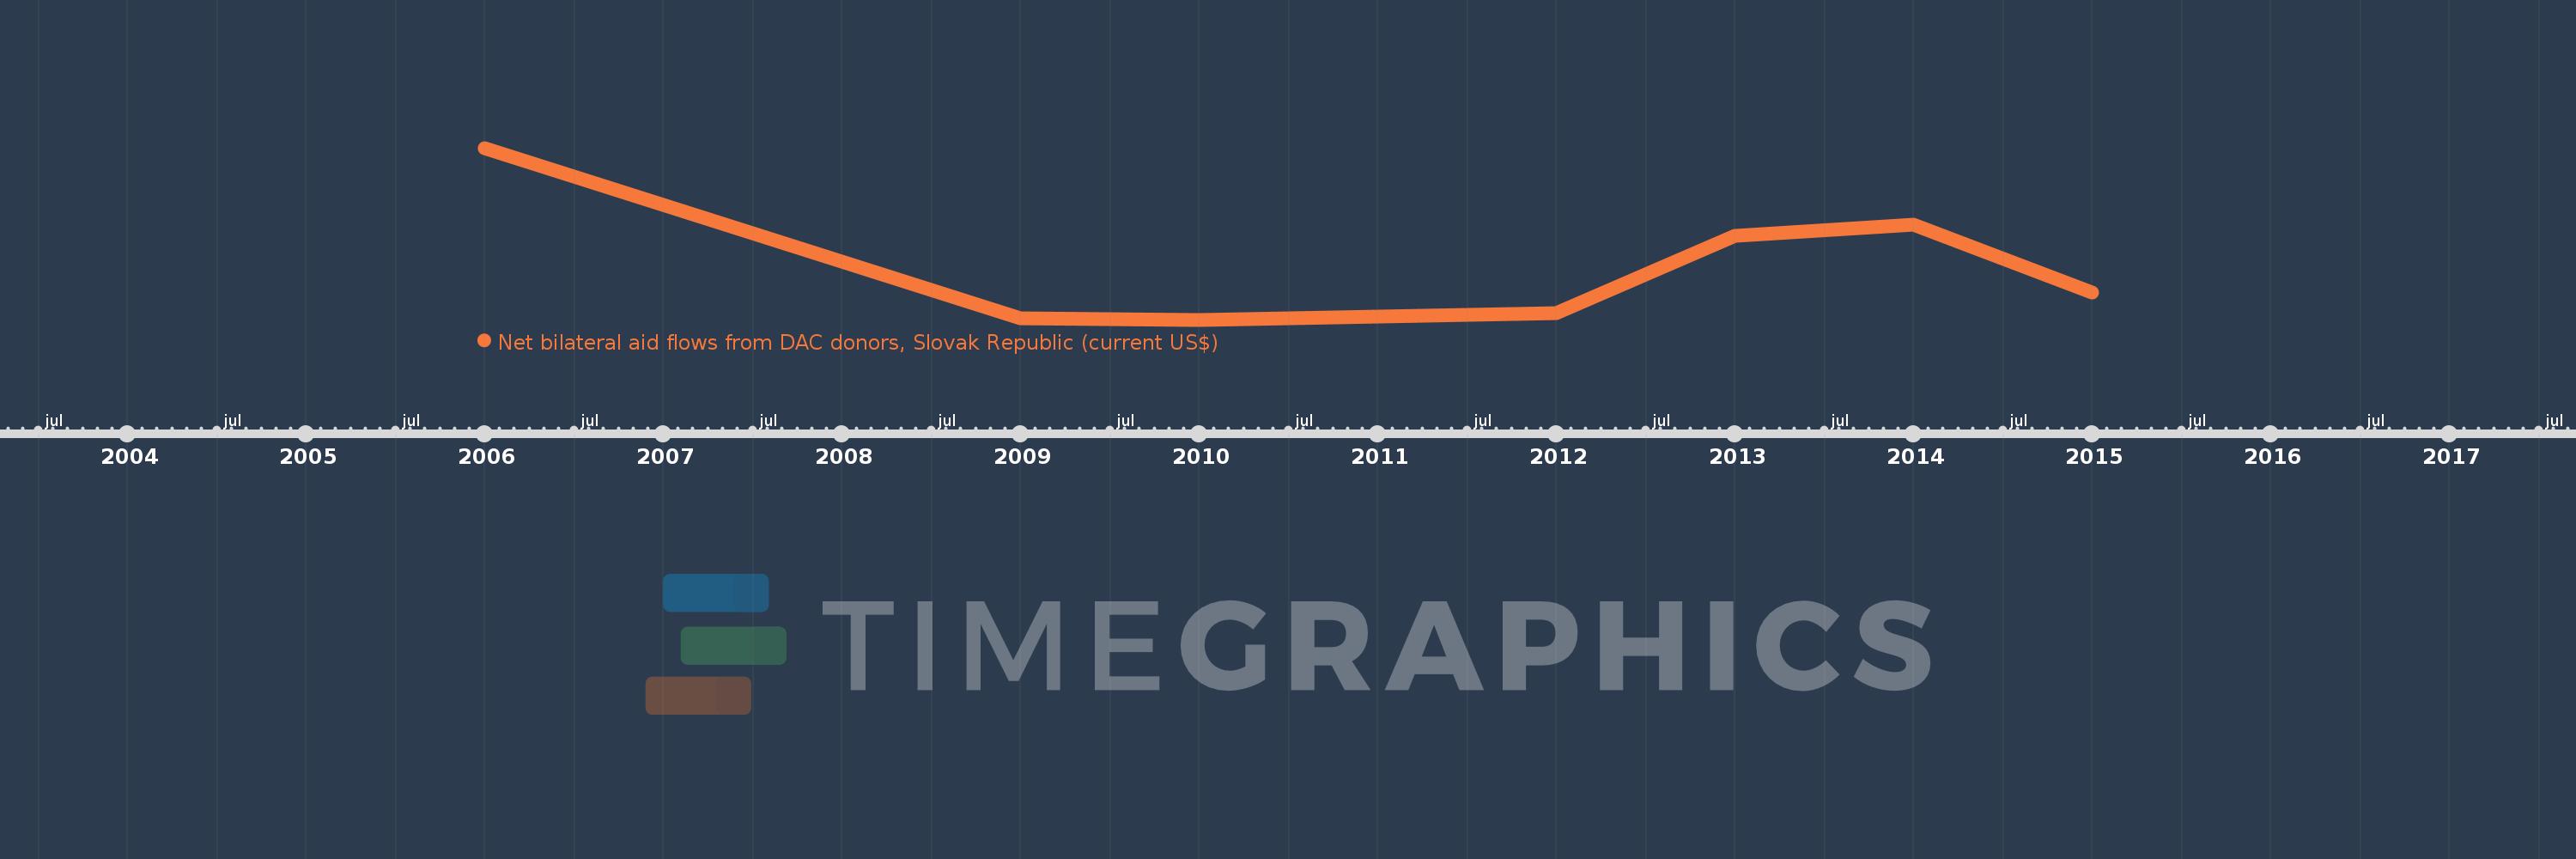
Diese Zeitleiste vorliegt die Graphik ab 2006 J. bis 2015 J. Middle East & North Africa (IDA & IBRD countries). Die Angaben bis 2005 J. sind nicht vorhanden. Die Zahl aktueller Beobachtungen nach Daten: 7.
Die Quelle (Bezeichnung):
Kennzahlen der Weltentwicklung
Die Quelle (Einrichtung):
Development Assistance Committee of the Organisation for Economic Co-operation and Development, Geographical Distribution of Financial Flows to Developing Countries, Development Co-operation Report, and International Development Statistics database. Data are available online at: www.oecd.org/dac/stats/idsonline.
Kategorien:
Aid Effectiveness
Es wurde aktualisiert:
23 Apr 2017 Jahr
Kennzahlen der Wertänderungen vom Jahr zum Jahr
im Durchschnitt:
427.143 Tsnd.
Minimum:
80.0 Tsnd.
1 Jan 2010 Jahr
Maximum:
1.16 Mln.
1 Jan 2006 Jahr
Zum Datum der Beobachtung
Wert
Absolute Veränderung
Die Veränderung bezüglich dem vorherigen Wert
1 Jan 2006 Jahr
1.16 Mln.
+1.16 Mln.
0.0%
1 Jan 2009 Jahr
90.0 Tsnd.
-1.07 Mln.
-92.24%
1 Jan 2010 Jahr
80.0 Tsnd.
-10.0 Tsnd.
-11.11%
1 Jan 2012 Jahr
120.0 Tsnd.
+40.0 Tsnd.
50.0%
1 Jan 2013 Jahr
610.0 Tsnd.
+490.0 Tsnd.
408.33%
1 Jan 2014 Jahr
680.0 Tsnd.
+70.0 Tsnd.
11.48%
1 Jan 2015 Jahr
250.0 Tsnd.
-430.0 Tsnd.
-63.24%
Bewertung der Länder gemäß mit laufender Statistik nach Jahren

Kommentare:

Abschicken
PremiumAbout & FeedbackVereinbarungPrivatheit
logo
© 2022 Selected Technologies LLC – Morgan Hill, California