33
/de/
AIzaSyAYiBZKx7MnpbEhh9jyipgxe19OcubqV5w
August 1, 2025
39885
IDA total
IDA
false
2
1
Firms that do not report all sales for tax purposes (% of firms)
2011,2010,2008,2007,2006,2005,2004,2003
Download
Bibliothek der Globalstatistik →IDA total →

Firms that do not report all sales for tax purposes (% of firms)

Diese Statistik in anderen Ländern:

AlbaniaAlgeriaAngolaArab WorldArgentinaArmeniaAzerbaijanBelarusBeninBoliviaBosnia and HerzegovinaBotswanaBulgariaBurkina FasoBurundiCabo VerdeCambodiaCameroonCaribbean small statesCentral Europe and the BalticsChileChinaColombiaCongo, Dem. Rep.Congo, Rep.Costa RicaCote d'IvoireCroatiaCzech RepublicDominican RepublicEarly-demographic dividendEast Asia & PacificEast Asia & Pacific (excluding high income)East Asia & Pacific (IDA & IBRD countries)EcuadorEgypt, Arab Rep.El SalvadorEstoniaEthiopiaEuro areaEurope & Central AsiaEurope & Central Asia (excluding high income)Europe & Central Asia (IDA & IBRD countries)European UnionFragile and conflict affected situationsGabonGambia, TheGeorgiaGhanaGreeceGuatemalaGuineaGuinea-BissauGuyanaHeavily indebted poor countries (HIPC)High incomeHondurasHungaryIBRD onlyIDA & IBRD totalIDA blendIDA onlyIDA totalIndiaIndonesiaIrelandJamaicaJordanKazakhstanKenyaKorea, Rep.Kyrgyz RepublicLao PDRLate-demographic dividendLatin America & Caribbean Latin America & Caribbean (excluding high income)Latin America & the Caribbean (IDA & IBRD countries)LatviaLeast developed countries: UN classificationLebanonLiberiaLithuaniaLow & middle incomeLow incomeLower middle incomeMacedonia, FYRMadagascarMalawiMaliMauritaniaMauritiusMexicoMiddle East & North AfricaMiddle East & North Africa (excluding high income)Middle East & North Africa (IDA & IBRD countries)Middle incomeMoldovaMongoliaMontenegroMozambiqueNamibiaNicaraguaNigerNigeriaOECD membersOmanOther small statesPakistanPanamaParaguayPeruPolandPortugalPost-demographic dividendPre-demographic dividendRomaniaRussian FederationRwandaSenegalSerbiaSierra LeoneSlovak RepublicSloveniaSmall statesSouth AfricaSouth AsiaSouth Asia (IDA & IBRD)SpainSri LankaSub-Saharan Africa Sub-Saharan Africa (excluding high income)Sub-Saharan Africa (IDA & IBRD countries)SwazilandSyrian Arab RepublicTajikistanTanzaniaTurkeyUgandaUkraineUpper middle incomeUruguayUzbekistanVietnamWest Bank and GazaWorldYemen, Rep.Zambia

Zeitlinie:

Diese Zeitleiste vorliegt die Graphik ab 2003 J. bis 2011 J. IDA total. Die Angaben bis 2002 J. sind nicht vorhanden. Die Zahl aktueller Beobachtungen nach Daten: 8.

Die Quelle (Bezeichnung):

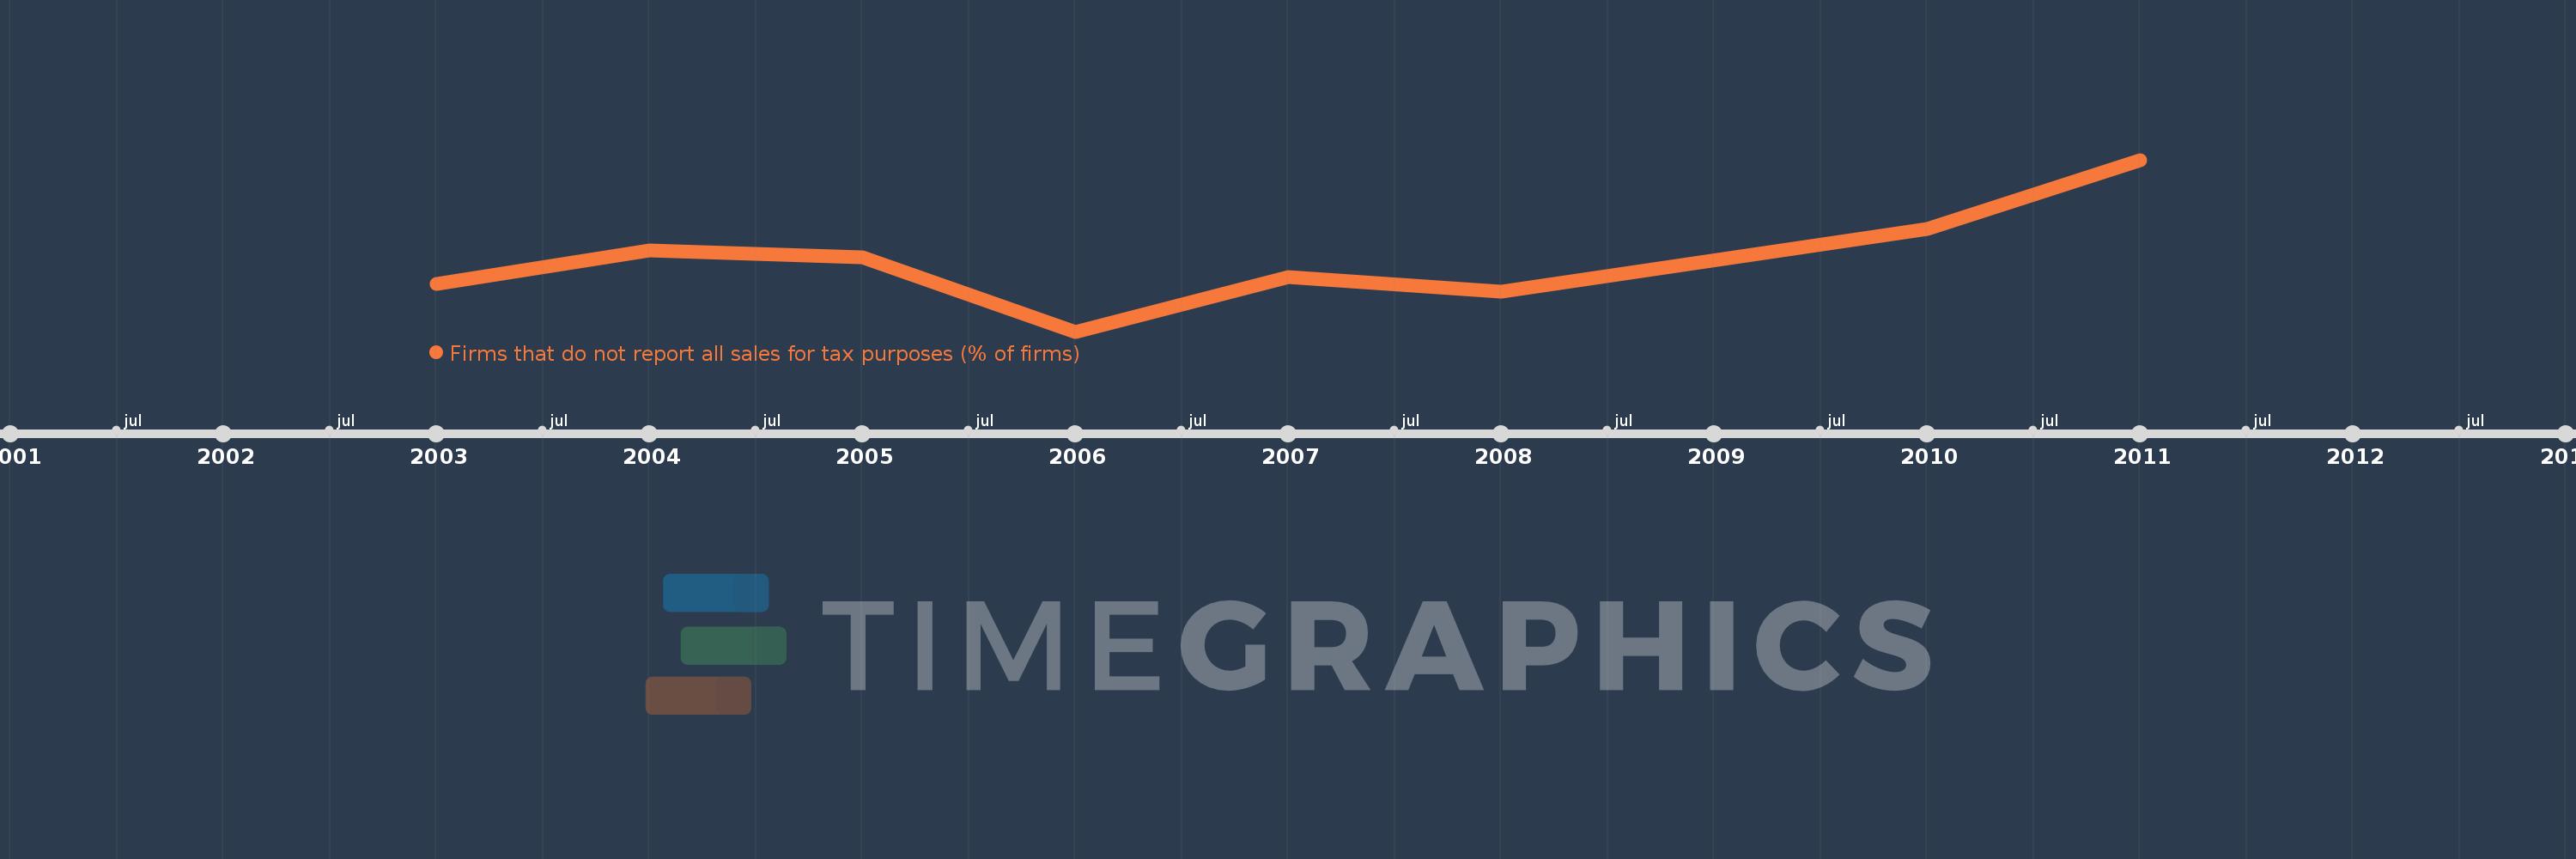
Kennzahlen der Weltentwicklung

Die Quelle (Einrichtung):

World Bank, Enterprise Surveys (http://www.enterprisesurveys.org/).

Kategorien:

Private Sector

Es wurde aktualisiert:

23 Apr 2017 Jahr

Kennzahlen der Wertänderungen vom Jahr zum Jahr

im Durchschnitt:
58.454
Minimum:
41.434
1 Jan 2006 Jahr
Maximum:
82.33
1 Jan 2011 Jahr
Zum Datum der Beobachtung
Wert
Absolute Veränderung
Die Veränderung bezüglich dem vorherigen Wert
1 Jan 2003 Jahr
52.75
+52.75
0.0%
1 Jan 2004 Jahr
60.843
+8.093
15.34%
1 Jan 2005 Jahr
59.07
-1.773
-2.91%
1 Jan 2006 Jahr
41.434
-17.636
-29.86%
1 Jan 2007 Jahr
54.371
+12.937
31.22%
1 Jan 2008 Jahr
50.983
-3.388
-6.23%
1 Jan 2010 Jahr
65.853
+14.87
29.17%
1 Jan 2011 Jahr
82.33
+16.477
25.02%

Bewertung der Länder gemäß mit laufender Statistik nach Jahren