33
/de/
AIzaSyAYiBZKx7MnpbEhh9jyipgxe19OcubqV5w
August 1, 2025
38305
IDA blend
IDB
false
2
1
Listed domestic companies, total
2015,2014,2013,2012,2011,2010,2009,2008,2007,2006,2005,2000,1999,1998,1997,1996
Download
Bibliothek der Globalstatistik →IDA blend →

Listed domestic companies, total

Diese Statistik in anderen Ländern:

Arab WorldArgentinaArmeniaAustraliaAustriaAzerbaijanBahrainBangladeshBarbadosBelarusBelgiumBermudaBhutanBoliviaBosnia and HerzegovinaBotswanaBrazilBulgariaCanadaCayman IslandsCentral Europe and the BalticsChannel IslandsChileChinaColombiaCosta RicaCote d'IvoireCroatiaCyprusCzech RepublicDenmarkDominican RepublicEarly-demographic dividendEast Asia & PacificEast Asia & Pacific (excluding high income)East Asia & Pacific (IDA & IBRD countries)EcuadorEgypt, Arab Rep.El SalvadorEstoniaEuro areaEurope & Central AsiaEurope & Central Asia (excluding high income)Europe & Central Asia (IDA & IBRD countries)European UnionFijiFinlandFranceGeorgiaGermanyGhanaGreeceGuatemalaGuyanaHigh incomeHondurasHong Kong SAR, ChinaHungaryIBRD onlyIcelandIDA & IBRD totalIDA blendIDA totalIndiaIndonesiaIran, Islamic Rep.IrelandIsraelItalyJamaicaJapanJordanKazakhstanKenyaKorea, Dem. People’s Rep.Korea, Rep.KuwaitKyrgyz RepublicLate-demographic dividendLatin America & Caribbean Latin America & Caribbean (excluding high income)Latin America & the Caribbean (IDA & IBRD countries)LatviaLebanonLithuaniaLow & middle incomeLower middle incomeLuxembourgMacedonia, FYRMalawiMalaysiaMaltaMauritiusMexicoMiddle East & North AfricaMiddle East & North Africa (excluding high income)Middle East & North Africa (IDA & IBRD countries)Middle incomeMoldovaMongoliaMontenegroMoroccoNamibiaNepalNetherlandsNew ZealandNigeriaNorth AmericaNorwayOECD membersOmanOther small statesPakistanPanamaPapua New GuineaParaguayPeruPhilippinesPolandPortugalPost-demographic dividendQatarRomaniaRussian FederationSaudi ArabiaSerbiaSeychellesSingaporeSlovak RepublicSloveniaSouth AfricaSouth AsiaSouth Asia (IDA & IBRD)SpainSri LankaSt. Kitts and NevisSub-Saharan Africa Sub-Saharan Africa (excluding high income)Sub-Saharan Africa (IDA & IBRD countries)SwazilandSwedenSwitzerlandTanzaniaThailandTrinidad and TobagoTunisiaTurkeyUgandaUkraineUnited Arab EmiratesUnited KingdomUnited StatesUpper middle incomeUruguayUzbekistanVenezuela, RBVietnamWest Bank and GazaWorldZambiaZimbabwe

Zeitlinie:

Diese Zeitleiste vorliegt die Graphik ab 1996 J. bis 2015 J. IDA blend. Die Angaben bis 1995 J. sind nicht vorhanden. Die Zahl aktueller Beobachtungen nach Daten: 16.

Die Quelle (Bezeichnung):

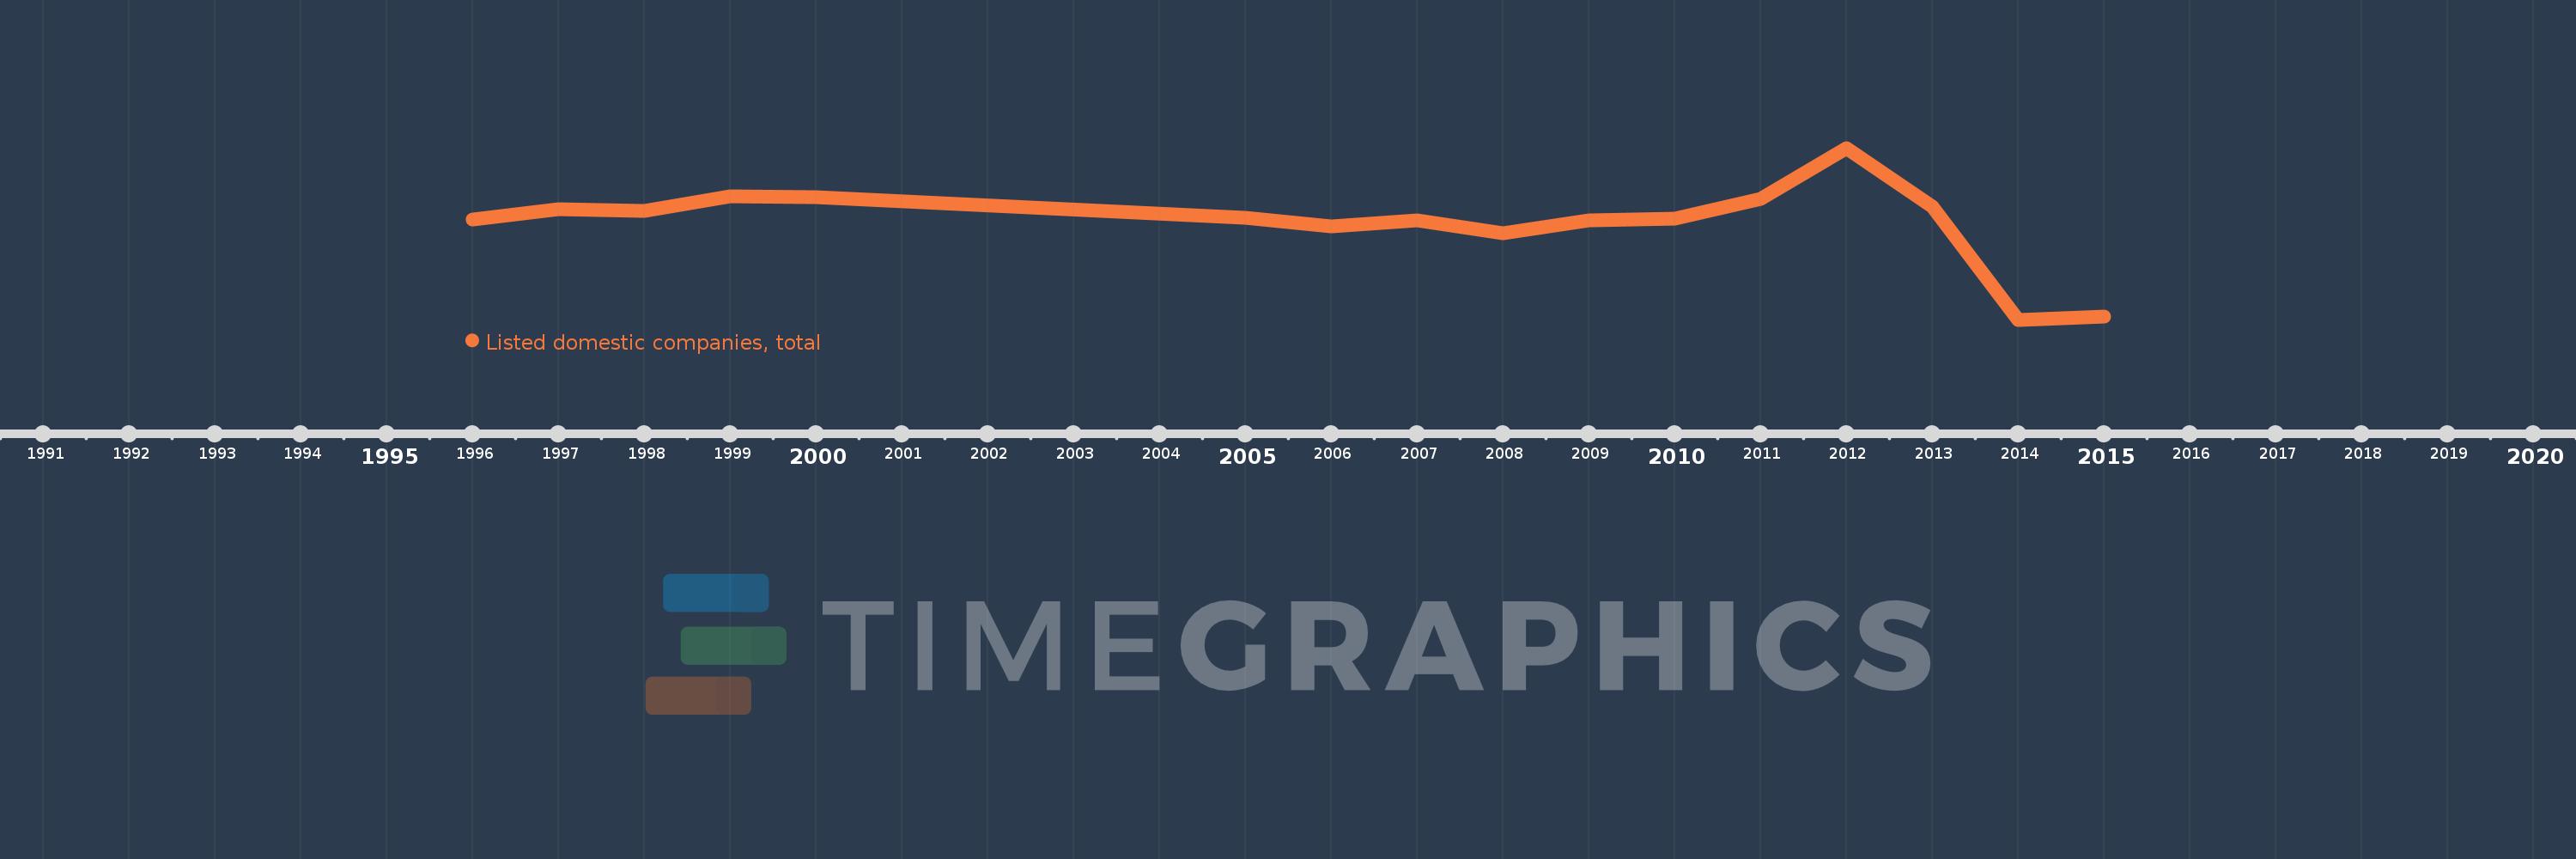
Kennzahlen der Weltentwicklung

Die Quelle (Einrichtung):

World Federation of Exchanges database.

Kategorien:

Financial Sector

Es wurde aktualisiert:

23 Apr 2017 Jahr

Kennzahlen der Wertänderungen vom Jahr zum Jahr

im Durchschnitt:
1.656 Tsnd.
Minimum:
1.339 Tsnd.
1 Jan 2014 Jahr
Maximum:
1.899 Tsnd.
1 Jan 2012 Jahr
Zum Datum der Beobachtung
Wert
Absolute Veränderung
Die Veränderung bezüglich dem vorherigen Wert
1 Jan 1996 Jahr
1.667 Tsnd.
+1.667 Tsnd.
0.0%
1 Jan 1997 Jahr
1.699 Tsnd.
+32.0
1.92%
1 Jan 1998 Jahr
1.694 Tsnd.
-5.0
-0.29%
1 Jan 1999 Jahr
1.741 Tsnd.
+47.0
2.77%
1 Jan 2000 Jahr
1.739 Tsnd.
-2.0
-0.11%
1 Jan 2005 Jahr
1.67 Tsnd.
-69.0
-3.97%
1 Jan 2006 Jahr
1.644 Tsnd.
-26.0
-1.56%
1 Jan 2007 Jahr
1.662 Tsnd.
+18.0
1.09%
1 Jan 2008 Jahr
1.62 Tsnd.
-42.0
-2.53%
1 Jan 2009 Jahr
1.662 Tsnd.
+42.0
2.59%
1 Jan 2010 Jahr
1.668 Tsnd.
+6.0
0.36%
1 Jan 2011 Jahr
1.732 Tsnd.
+64.0
3.84%
1 Jan 2012 Jahr
1.899 Tsnd.
+167.0
9.64%
1 Jan 2013 Jahr
1.709 Tsnd.
-190.0
-10.01%
1 Jan 2014 Jahr
1.339 Tsnd.
-370.0
-21.65%
1 Jan 2015 Jahr
1.35 Tsnd.
+11.0
0.82%

Bewertung der Länder gemäß mit laufender Statistik nach Jahren