30
/de/
AIzaSyAYiBZKx7MnpbEhh9jyipgxe19OcubqV5w
April 1, 2024
37650
IDA & IBRD total
IBT
false
2
1
Newborns protected against tetanus (%)
2016,2015,2014,2013,2012,2011,2010,2009,2008,2007,2006,2005,2004,2003
Download
Bibliothek der Globalstatistik →IDA & IBRD total →

Newborns protected against tetanus (%)

Diese Statistik in anderen Ländern:

AfghanistanAlbaniaAlgeriaAngolaArab WorldBahamas, TheBahrainBangladeshBelizeBeninBhutanBoliviaBotswanaBrazilBrunei DarussalamBurkina FasoBurundiCabo VerdeCambodiaCameroonCaribbean small statesCentral African RepublicChadColombiaComorosCongo, Dem. Rep.Congo, Rep.Cote d'IvoireDjiboutiDominican RepublicEarly-demographic dividendEcuadorEgypt, Arab Rep.El SalvadorEquatorial GuineaEritreaEthiopiaFijiFragile and conflict affected situationsGabonGambia, TheGhanaGuatemalaGuineaGuinea-BissauGuyanaHaitiHeavily indebted poor countries (HIPC)HondurasIDA & IBRD totalIDA blendIDA onlyIDA totalIndiaIndonesiaIran, Islamic Rep.IraqJamaicaJordanKenyaKiribatiKorea, Dem. People’s Rep.KuwaitLao PDRLatin America & Caribbean Latin America & Caribbean (excluding high income)Latin America & the Caribbean (IDA & IBRD countries)Least developed countries: UN classificationLesothoLiberiaLow & middle incomeLow incomeLower middle incomeMadagascarMalawiMalaysiaMaldivesMaliMauritaniaMauritiusMexicoMiddle East & North AfricaMiddle East & North Africa (excluding high income)Middle East & North Africa (IDA & IBRD countries)Middle incomeMoroccoMozambiqueMyanmarNamibiaNepalNicaraguaNigerNigeriaOmanOther small statesPacific island small statesPakistanPapua New GuineaParaguayPeruPhilippinesPre-demographic dividendRwandaSao Tome and PrincipeSenegalSeychellesSierra LeoneSmall statesSolomon IslandsSomaliaSouth AfricaSouth AsiaSouth Asia (IDA & IBRD)South SudanSri LankaSub-Saharan Africa Sub-Saharan Africa (excluding high income)Sub-Saharan Africa (IDA & IBRD countries)SudanSurinameSwazilandSyrian Arab RepublicTanzaniaThailandTimor-LesteTogoTunisiaTurkeyUgandaVanuatuVenezuela, RBVietnamYemen, Rep.ZambiaZimbabwe

Zeitlinie:

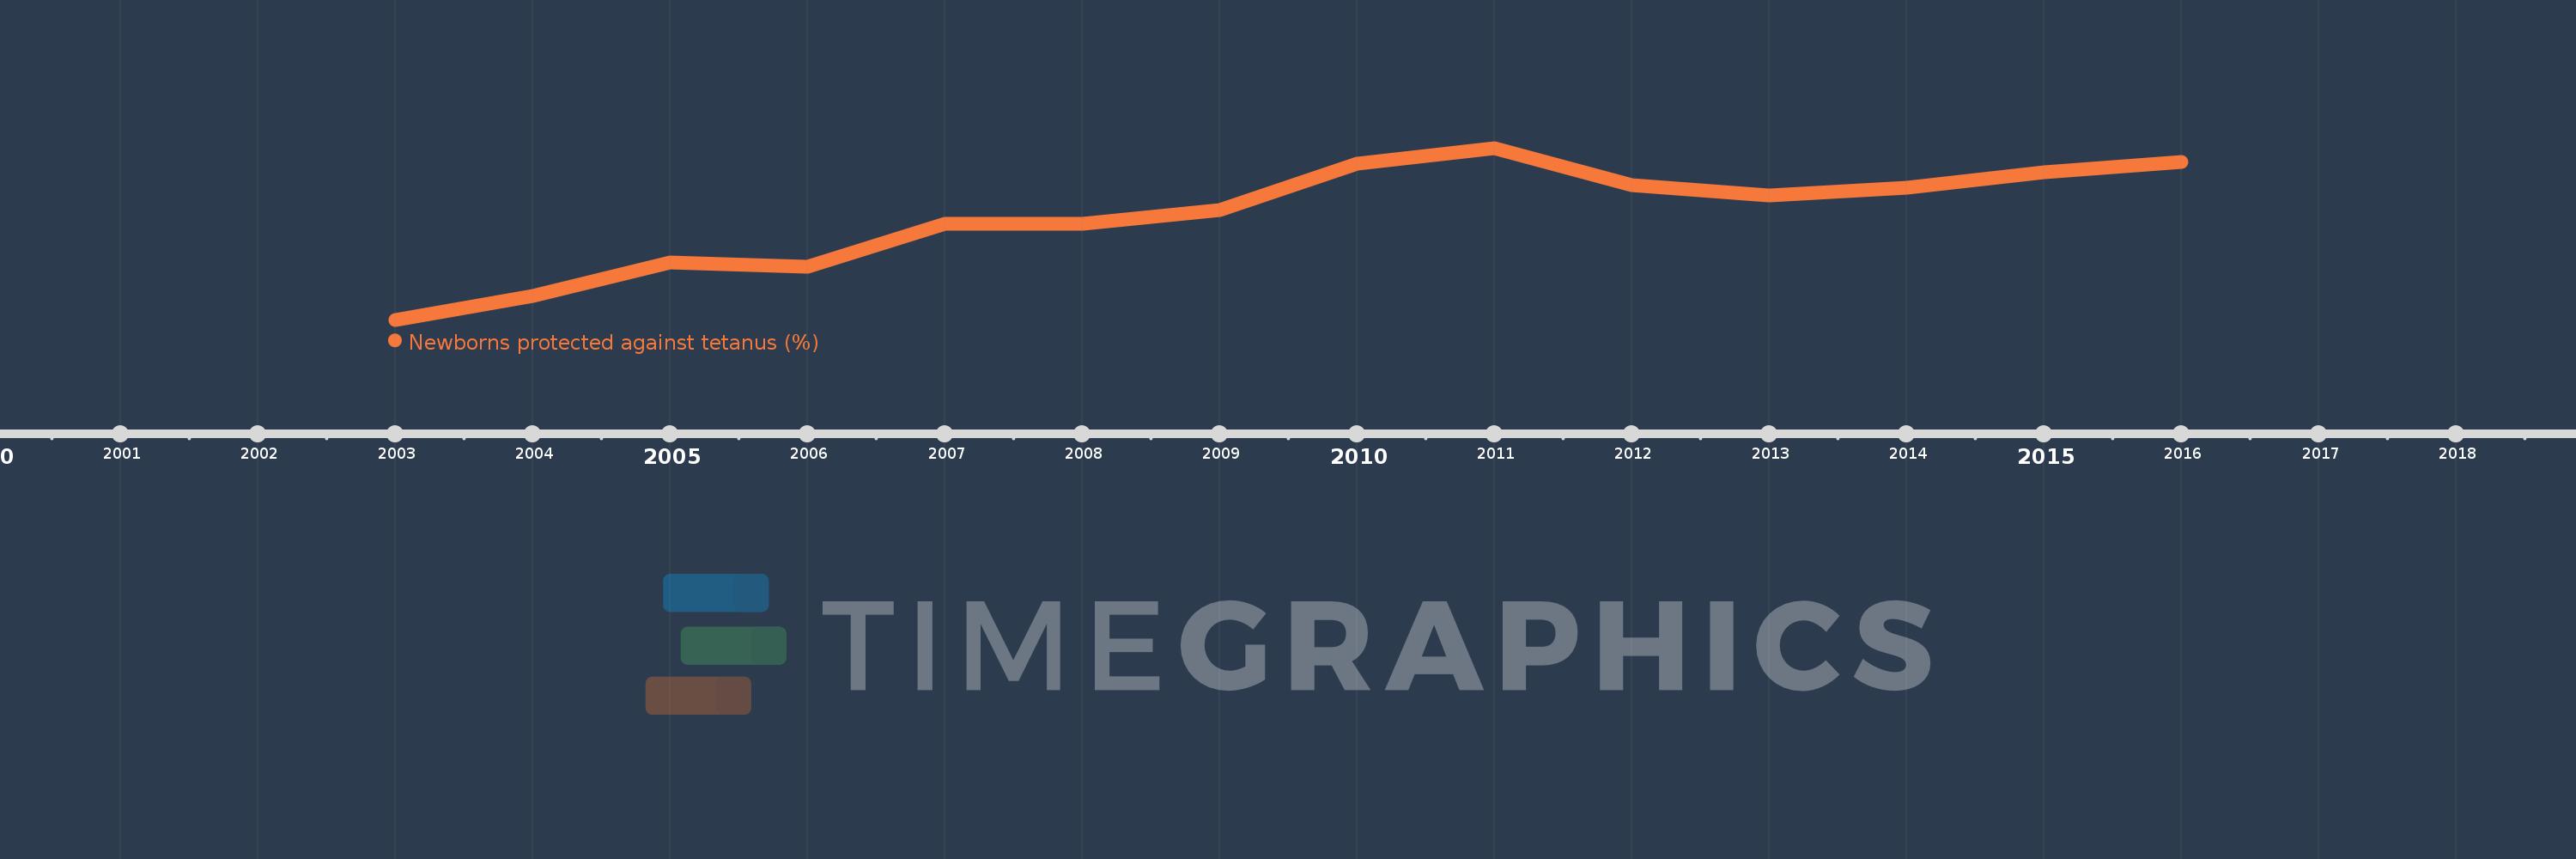
Diese Zeitleiste vorliegt die Graphik ab 2003 J. bis 2016 J. IDA & IBRD total. Die Angaben bis 2002 J. sind nicht vorhanden. Die Zahl aktueller Beobachtungen nach Daten: 14.

Die Quelle (Bezeichnung):

Kennzahlen der Weltentwicklung

Die Quelle (Einrichtung):

WHO and UNICEF (http://www.who.int/immunization/monitoring_surveillance/en/).

Kategorien:

Health

Es wurde aktualisiert:

23 Apr 2017 Jahr

Kennzahlen der Wertänderungen vom Jahr zum Jahr

im Durchschnitt:
80.786
Minimum:
76.095
1 Jan 2003 Jahr
Maximum:
83.825
1 Jan 2011 Jahr
Zum Datum der Beobachtung
Wert
Absolute Veränderung
Die Veränderung bezüglich dem vorherigen Wert
1 Jan 2003 Jahr
76.095
+76.095
0.0%
1 Jan 2004 Jahr
77.18
+1.085
1.43%
1 Jan 2005 Jahr
78.66
+1.479
1.92%
1 Jan 2006 Jahr
78.482
-0.178
-0.23%
1 Jan 2007 Jahr
80.407
+1.925
2.45%
1 Jan 2008 Jahr
80.412
+0.005
0.01%
1 Jan 2009 Jahr
81.015
+0.603
0.75%
1 Jan 2010 Jahr
83.116
+2.102
2.59%
1 Jan 2011 Jahr
83.825
+0.708
0.85%
1 Jan 2012 Jahr
82.166
-1.659
-1.98%
1 Jan 2013 Jahr
81.684
-0.482
-0.59%
1 Jan 2014 Jahr
82.022
+0.338
0.41%
1 Jan 2015 Jahr
82.746
+0.724
0.88%
1 Jan 2016 Jahr
83.189
+0.443
0.54%

Bewertung der Länder gemäß mit laufender Statistik nach Jahren