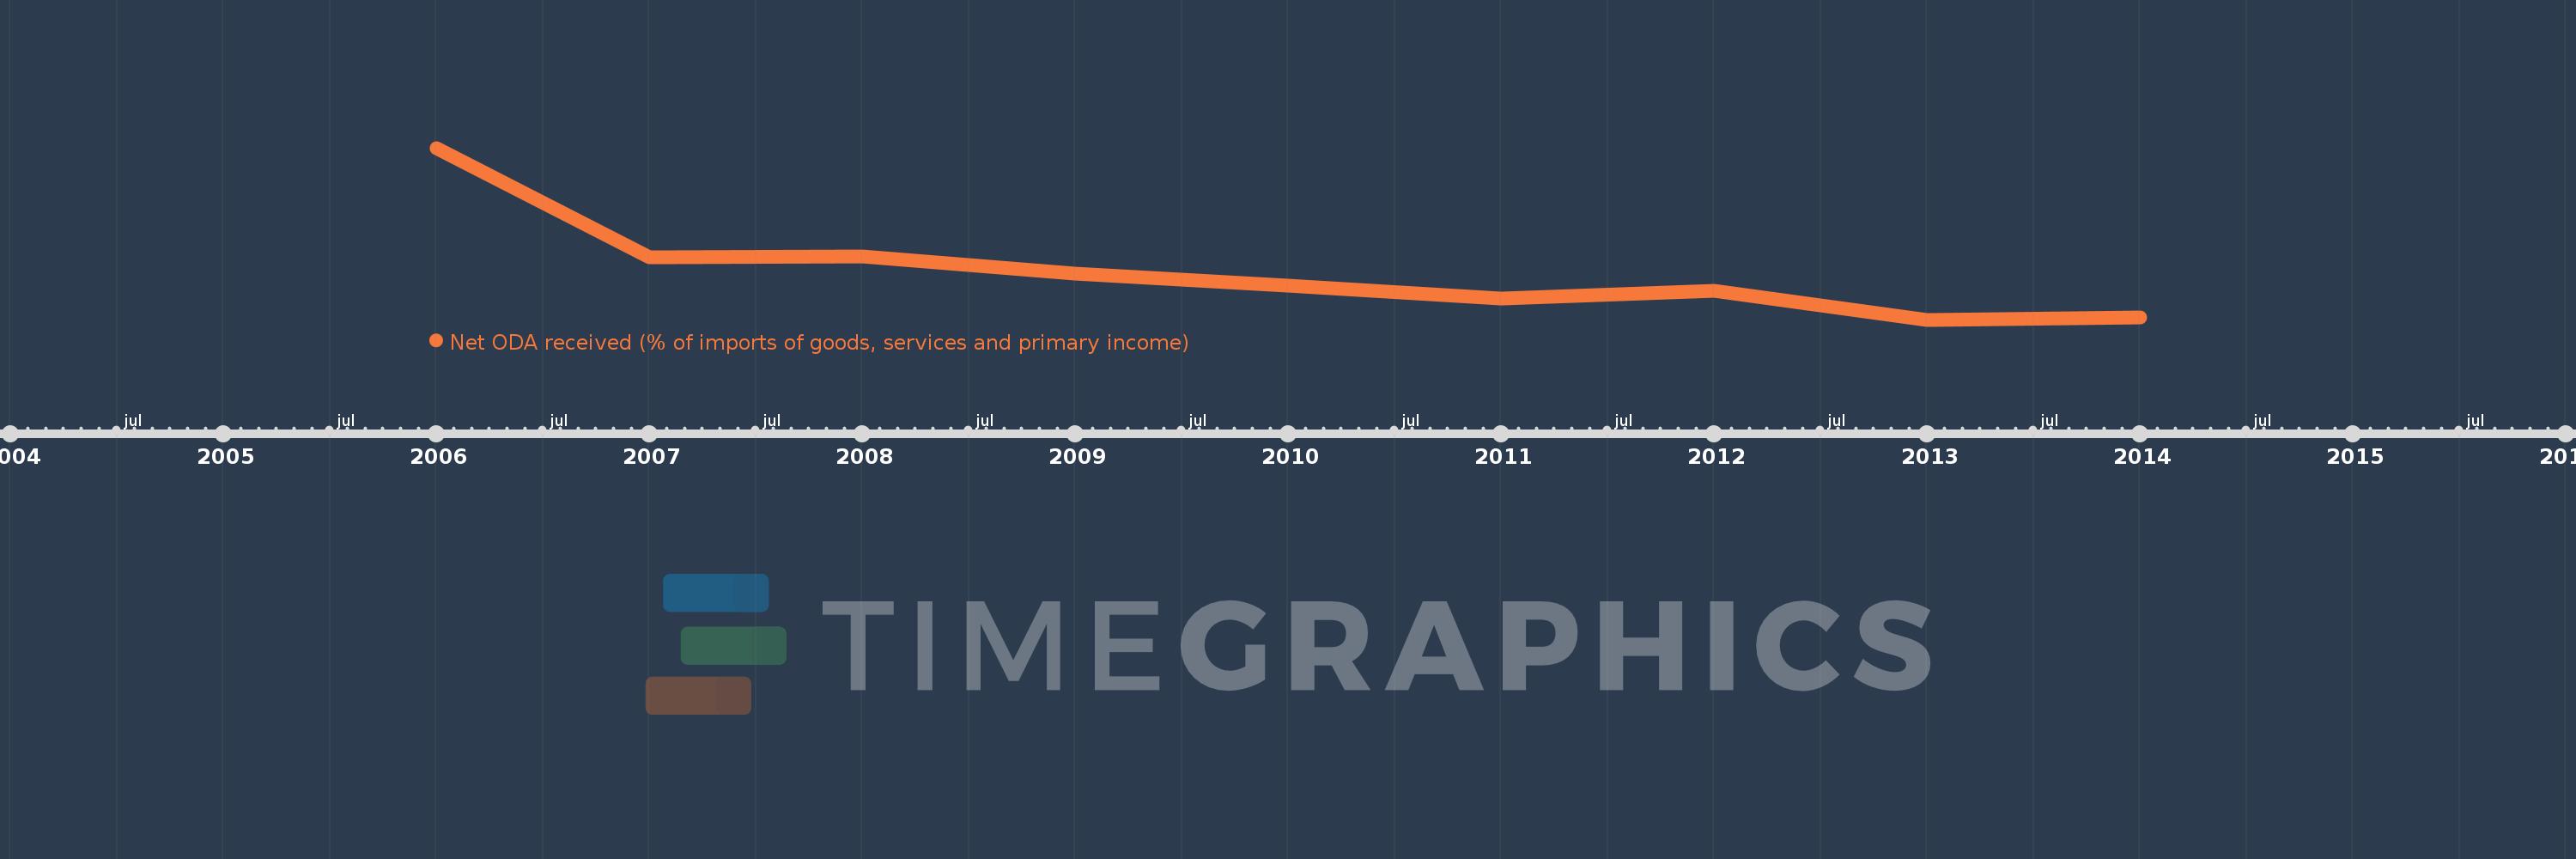
Diese Zeitleiste vorliegt die Graphik ab 2006 J. bis 2014 J. Fragile and conflict affected situations. Die Angaben bis 2005 J. sind nicht vorhanden. Die Zahl aktueller Beobachtungen nach Daten: 9.
Die Quelle (Bezeichnung):
Kennzahlen der Weltentwicklung
Die Quelle (Einrichtung):
Development Assistance Committee of the Organisation for Economic Co-operation and Development, Geographical Distribution of Financial Flows to Developing Countries, Development Co-operation Report, and International Development Statistics database. Data are available online at: www.oecd.org/dac/stats/idsonline. World Bank imports of good and services estimates are used for the denominator.
Kategorien:
Aid Effectiveness
Es wurde aktualisiert:
23 Apr 2017 Jahr
Kennzahlen der Wertänderungen vom Jahr zum Jahr
im Durchschnitt:
14.511
Minimum:
10.397
1 Jan 2013 Jahr
Maximum:
25.192
1 Jan 2006 Jahr
Zum Datum der Beobachtung
Wert
Absolute Veränderung
Die Veränderung bezüglich dem vorherigen Wert
1 Jan 2006 Jahr
25.192
+25.192
0.0%
1 Jan 2007 Jahr
15.766
-9.425
-37.41%
1 Jan 2008 Jahr
15.838
+0.072
0.46%
1 Jan 2009 Jahr
14.406
-1.432
-9.04%
1 Jan 2010 Jahr
13.36
-1.046
-7.26%
1 Jan 2011 Jahr
12.202
-1.158
-8.67%
1 Jan 2012 Jahr
12.856
+0.654
5.36%
1 Jan 2013 Jahr
10.397
-2.46
-19.13%
1 Jan 2014 Jahr
10.579
+0.182
1.75%
Bewertung der Länder gemäß mit laufender Statistik nach Jahren