29
/de/
de
AIzaSyAYiBZKx7MnpbEhh9jyipgxe19OcubqV5w
April 1, 2024
31930
Europe & Central Asia (excluding high income)
ECA
false
2
1
Net official flows from UN agencies, IAEA (current US$)
2015,2014,2013,2012,2011,2010,2009,2008,2007
Download
Bibliothek der Globalstatistik →Europe & Central Asia (excluding high income) →

Net official flows from UN agencies, IAEA (current US$)

Diese Statistik in anderen Ländern:
AfghanistanAlbaniaAlgeriaAngolaArab WorldArgentinaArmeniaAzerbaijanBangladeshBelarusBelizeBeninBoliviaBosnia and HerzegovinaBotswanaBrazilBurkina FasoBurundiCambodiaCameroonCaribbean small statesCentral African RepublicCentral Europe and the BalticsChadChileChinaColombiaCongo, Dem. Rep.Costa RicaCote d'IvoireCroatiaCubaDominican RepublicEast Asia & PacificEast Asia & Pacific (excluding high income)East Asia & Pacific (IDA & IBRD countries)EcuadorEgypt, Arab Rep.El SalvadorEritreaEthiopiaEurope & Central AsiaEurope & Central Asia (excluding high income)Europe & Central Asia (IDA & IBRD countries)European UnionFragile and conflict affected situationsGabonGeorgiaGhanaGuatemalaHaitiHeavily indebted poor countries (HIPC)High incomeHondurasIBRD onlyIDA & IBRD totalIDA blendIDA onlyIDA totalIndonesiaIran, Islamic Rep.IraqJamaicaJordanKazakhstanKenyaKyrgyz RepublicLao PDRLatin America & Caribbean Latin America & Caribbean (excluding high income)Latin America & the Caribbean (IDA & IBRD countries)Least developed countries: UN classificationLebanonLesothoLibyaLow & middle incomeLow incomeLower middle incomeMacedonia, FYRMadagascarMalawiMalaysiaMaliMauritaniaMauritiusMexicoMiddle East & North AfricaMiddle East & North Africa (excluding high income)Middle East & North Africa (IDA & IBRD countries)Middle incomeMoldovaMongoliaMontenegroMoroccoMozambiqueMyanmarNamibiaNepalNicaraguaNigerNigeriaNorth AmericaOECD membersOmanOther small statesPacific island small statesPakistanPalauPanamaParaguayPeruPhilippinesSenegalSerbiaSeychellesSierra LeoneSmall statesSouth AfricaSouth AsiaSouth Asia (IDA & IBRD)Sri LankaSub-Saharan Africa Sub-Saharan Africa (excluding high income)Sub-Saharan Africa (IDA & IBRD countries)SudanSyrian Arab RepublicTajikistanTanzaniaThailandTogoTunisiaTurkeyUgandaUkraineUpper middle incomeUruguayUzbekistanVenezuela, RBVietnamWest Bank and GazaWorldYemen, Rep.ZambiaZimbabwe
Zeitlinie:
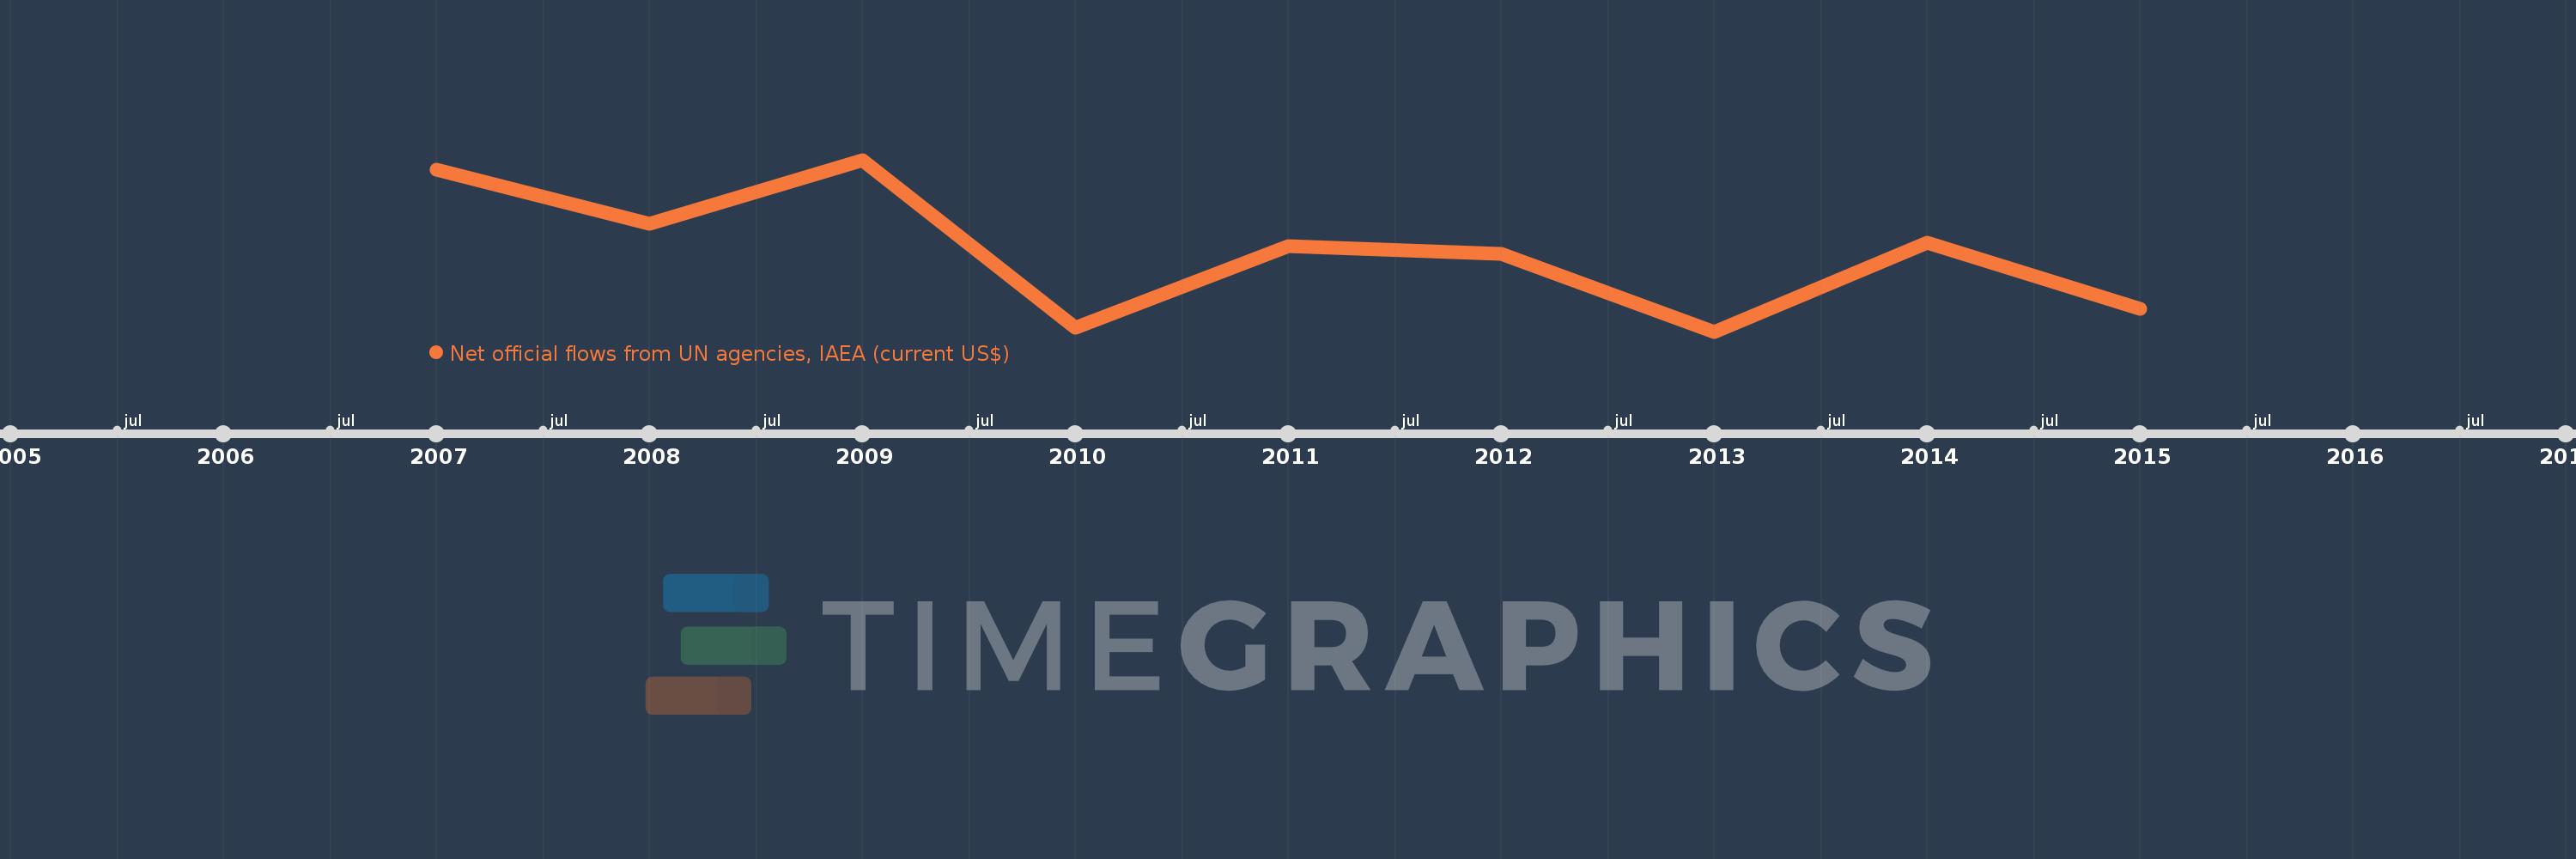
Diese Zeitleiste vorliegt die Graphik ab 2007 J. bis 2015 J. Europe & Central Asia (excluding high income). Die Angaben bis 2006 J. sind nicht vorhanden. Die Zahl aktueller Beobachtungen nach Daten: 9.
Die Quelle (Bezeichnung):
Kennzahlen der Weltentwicklung
Die Quelle (Einrichtung):
Development Assistance Committee of the Organisation for Economic Co-operation and Development, Geographical Distribution of Financial Flows to Developing Countries, Development Co-operation Report, and International Development Statistics database. Data are available online at: www.oecd.org/dac/stats/idsonline.
Kategorien:
Aid Effectiveness
Es wurde aktualisiert:
23 Apr 2017 Jahr
Kennzahlen der Wertänderungen vom Jahr zum Jahr
im Durchschnitt:
8.299 Mln.
Minimum:
6.35 Mln.
1 Jan 2013 Jahr
Maximum:
10.54 Mln.
1 Jan 2009 Jahr
Zum Datum der Beobachtung
Wert
Absolute Veränderung
Die Veränderung bezüglich dem vorherigen Wert
1 Jan 2007 Jahr
10.29 Mln.
+10.29 Mln.
0.0%
1 Jan 2008 Jahr
8.97 Mln.
-1.32 Mln.
-12.83%
1 Jan 2009 Jahr
10.54 Mln.
+1.57 Mln.
17.5%
1 Jan 2010 Jahr
6.44 Mln.
-4.1 Mln.
-38.9%
1 Jan 2011 Jahr
8.43 Mln.
+1.99 Mln.
30.9%
1 Jan 2012 Jahr
8.24 Mln.
-190.0 Tsnd.
-2.25%
1 Jan 2013 Jahr
6.35 Mln.
-1.89 Mln.
-22.94%
1 Jan 2014 Jahr
8.52 Mln.
+2.17 Mln.
34.17%
1 Jan 2015 Jahr
6.91 Mln.
-1.61 Mln.
-18.9%
Bewertung der Länder gemäß mit laufender Statistik nach Jahren

Kommentare:

Abschicken
PremiumAbout & FeedbackVereinbarungPrivatheit
logo
© 2022 Selected Technologies LLC – Morgan Hill, California