33
/de/
AIzaSyAYiBZKx7MnpbEhh9jyipgxe19OcubqV5w
August 1, 2025
29211
East Asia & Pacific (IDA & IBRD countries)
TEA
false
2
1
Investment in telecoms with private participation (current US$)
2007,2006,2005,2004,2003,2002,2001,2000,1998
Download
Bibliothek der Globalstatistik →East Asia & Pacific (IDA & IBRD countries) →

Investment in telecoms with private participation (current US$)

Diese Statistik in anderen Ländern:

AfghanistanAlbaniaAlgeriaAmerican SamoaAngolaAntigua and BarbudaArgentinaArmeniaAzerbaijanBangladeshBelarusBelizeBeninBhutanBoliviaBosnia and HerzegovinaBotswanaBrazilBulgariaBurkina FasoBurundiCabo VerdeCambodiaCameroonCentral African RepublicChadChileChinaColombiaCongo, Dem. Rep.Congo, Rep.Costa RicaCote d'IvoireCubaDominicaDominican RepublicEarly-demographic dividendEast Asia & Pacific (excluding high income)East Asia & Pacific (IDA & IBRD countries)EcuadorEgypt, Arab Rep.El SalvadorEritreaEthiopiaEurope & Central Asia (excluding high income)Europe & Central Asia (IDA & IBRD countries)FijiFragile and conflict affected situationsGabonGambia, TheGeorgiaGhanaGrenadaGuatemalaGuineaGuinea-BissauGuyanaHaitiHeavily indebted poor countries (HIPC)HondurasIBRD onlyIDA & IBRD totalIDA blendIDA onlyIDA totalIndiaIndonesiaIran, Islamic Rep.IraqJamaicaJordanKazakhstanKenyaKiribatiKorea, Dem. People’s Rep.KosovoKyrgyz RepublicLao PDRLate-demographic dividendLatin America & Caribbean Latin America & Caribbean (excluding high income)Latin America & the Caribbean (IDA & IBRD countries)Least developed countries: UN classificationLebanonLesothoLiberiaLithuaniaLow & middle incomeLow incomeLower middle incomeMacedonia, FYRMadagascarMalawiMalaysiaMaldivesMaliMauritaniaMauritiusMexicoMicronesia, Fed. Sts.Middle East & North Africa (excluding high income)Middle East & North Africa (IDA & IBRD countries)Middle incomeMoldovaMongoliaMontenegroMoroccoMozambiqueMyanmarNamibiaNepalNicaraguaNigerNigeriaOther small statesPacific island small statesPakistanPanamaPapua New GuineaParaguayPeruPhilippinesPre-demographic dividendRomaniaRussian FederationRwandaSamoaSenegalSerbiaSeychellesSierra LeoneSomaliaSouth AfricaSouth AsiaSouth Asia (IDA & IBRD)South SudanSri LankaSt. Kitts and NevisSt. LuciaSt. Vincent and the GrenadinesSub-Saharan Africa Sub-Saharan Africa (excluding high income)Sub-Saharan Africa (IDA & IBRD countries)SudanSurinameSwazilandSyrian Arab RepublicTajikistanTanzaniaThailandTimor-LesteTogoTongaTunisiaTurkeyTurkmenistanUgandaUkraineUpper middle incomeUruguayUzbekistanVanuatuVenezuela, RBVietnamWest Bank and GazaYemen, Rep.ZambiaZimbabwe

Zeitlinie:

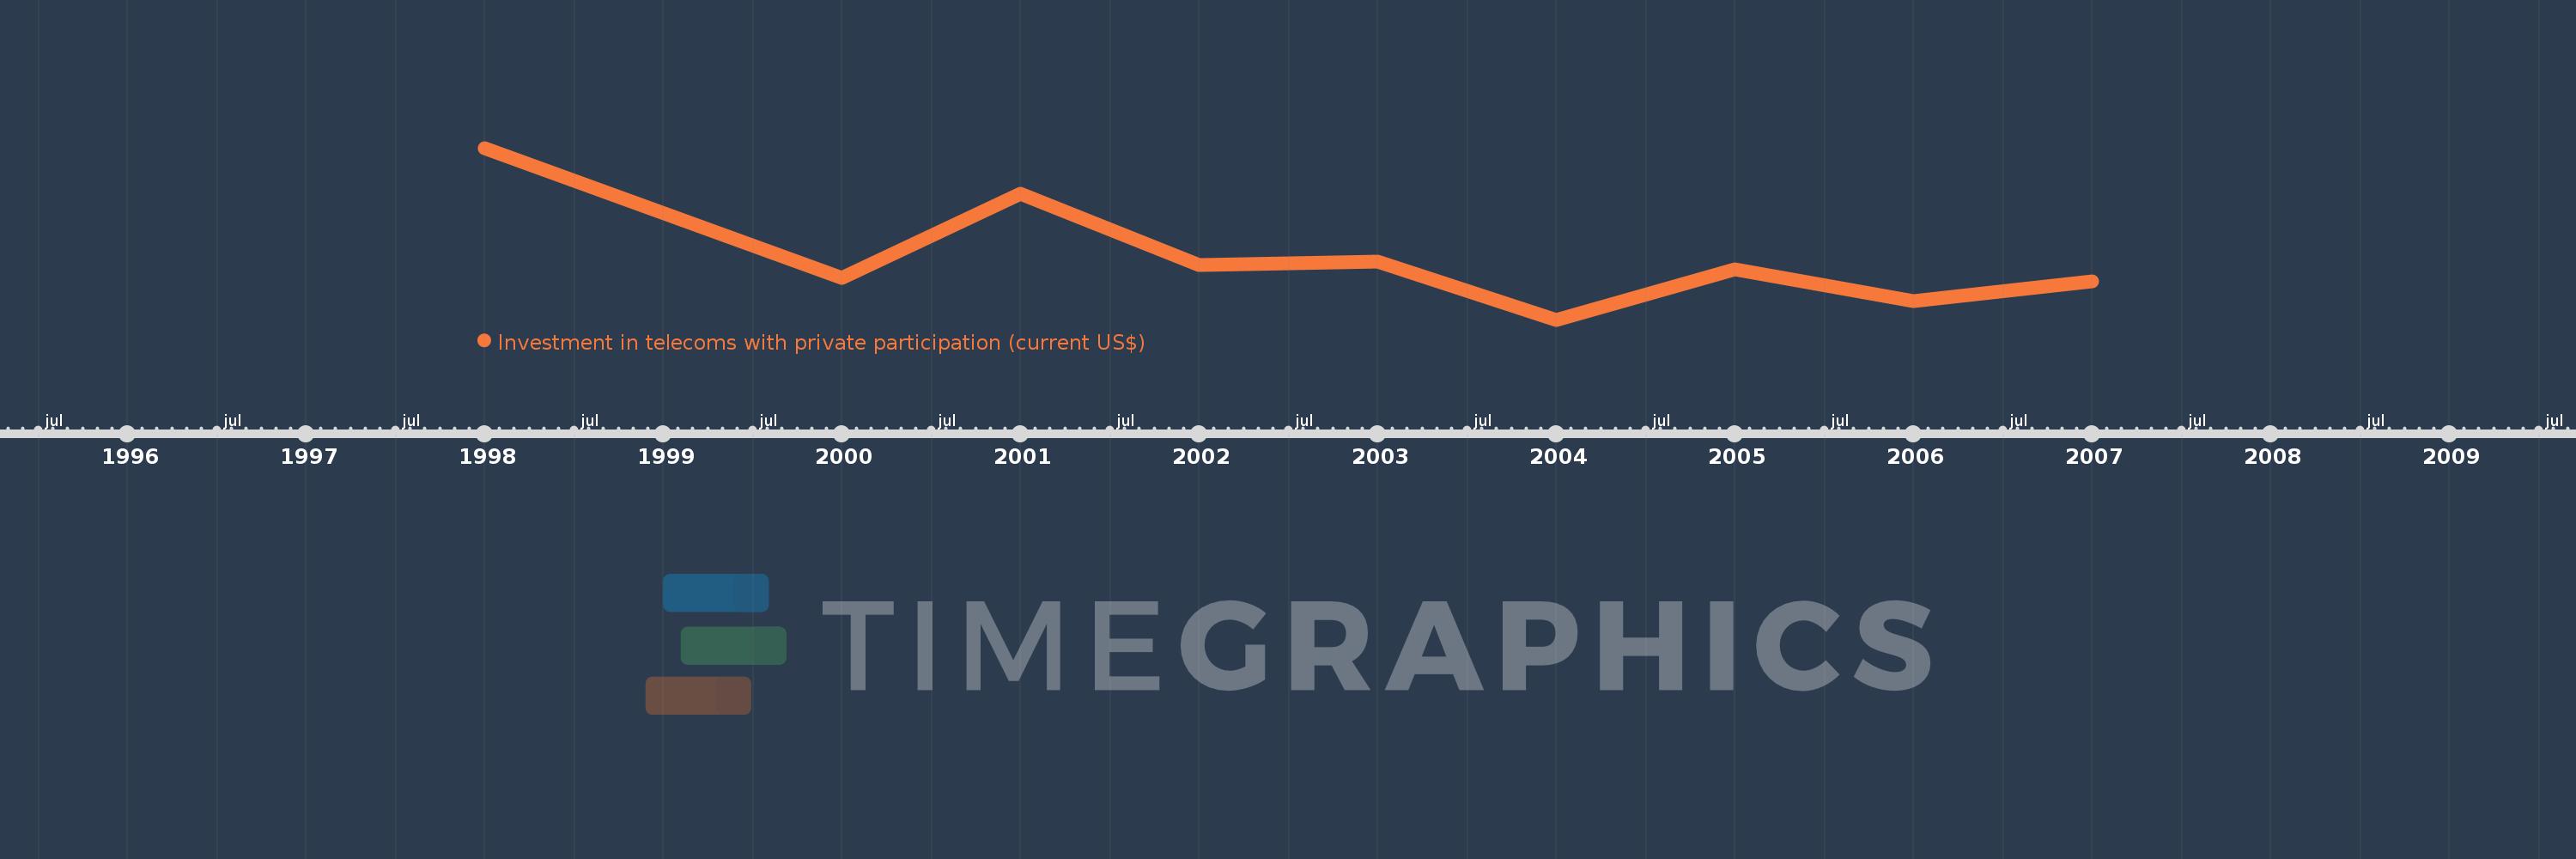
Diese Zeitleiste vorliegt die Graphik ab 1998 J. bis 2007 J. East Asia & Pacific (IDA & IBRD countries). Die Angaben bis 1997 J. sind nicht vorhanden. Die Zahl aktueller Beobachtungen nach Daten: 9.

Die Quelle (Bezeichnung):

Kennzahlen der Weltentwicklung

Die Quelle (Einrichtung):

World Bank, Private Participation in Infrastructure Project Database (http://ppi.worldbank.org).

Kategorien:

Infrastructure, Private Sector

Es wurde aktualisiert:

23 Apr 2017 Jahr

Kennzahlen der Wertänderungen vom Jahr zum Jahr

im Durchschnitt:
5.322 Mlrd.
Minimum:
3.077 Mlrd.
1 Jan 2004 Jahr
Maximum:
9.289 Mlrd.
1 Jan 1998 Jahr
Zum Datum der Beobachtung
Wert
Absolute Veränderung
Die Veränderung bezüglich dem vorherigen Wert
1 Jan 1998 Jahr
9.289 Mlrd.
+9.289 Mlrd.
0.0%
1 Jan 2000 Jahr
4.581 Mlrd.
-4.708 Mlrd.
-50.68%
1 Jan 2001 Jahr
7.619 Mlrd.
+3.038 Mlrd.
66.31%
1 Jan 2002 Jahr
5.043 Mlrd.
-2.576 Mlrd.
-33.82%
1 Jan 2003 Jahr
5.191 Mlrd.
+148.14 Mln.
2.94%
1 Jan 2004 Jahr
3.077 Mlrd.
-2.114 Mlrd.
-40.73%
1 Jan 2005 Jahr
4.906 Mlrd.
+1.829 Mlrd.
59.46%
1 Jan 2006 Jahr
3.74 Mlrd.
-1.166 Mlrd.
-23.77%
1 Jan 2007 Jahr
4.457 Mlrd.
+716.4 Mln.
19.15%

Bewertung der Länder gemäß mit laufender Statistik nach Jahren