30
/de/
AIzaSyAYiBZKx7MnpbEhh9jyipgxe19OcubqV5w
April 1, 2024
282980
Vietnam
VNM
true
2
1
School enrollment, tertiary (gross), gender parity index (GPI)
2015,2014,2012,2011,2010,2009,2008,2007,2006,2004,2003,2002,2001,2000,1999,1982,1980,1979,1978,1977
Download
Bibliothek der Globalstatistik →Vietnam →

School enrollment, tertiary (gross), gender parity index (GPI)

Diese Statistik in anderen Ländern:

AfghanistanAlbaniaAlgeriaAngolaAntigua and BarbudaArab WorldArgentinaArmeniaArubaAustraliaAustriaAzerbaijanBahamas, TheBahrainBangladeshBarbadosBelarusBelgiumBelizeBeninBermudaBhutanBoliviaBosnia and HerzegovinaBotswanaBrazilBrunei DarussalamBulgariaBurkina FasoBurundiCabo VerdeCambodiaCameroonCanadaCaribbean small statesCentral African RepublicCentral Europe and the BalticsChadChileChinaColombiaComorosCongo, Dem. Rep.Congo, Rep.Costa RicaCote d'IvoireCroatiaCubaCuracaoCyprusCzech RepublicDenmarkDjiboutiDominicaDominican RepublicEarly-demographic dividendEast Asia & PacificEast Asia & Pacific (excluding high income)East Asia & Pacific (IDA & IBRD countries)EcuadorEgypt, Arab Rep.El SalvadorEquatorial GuineaEritreaEstoniaEthiopiaEuro areaEurope & Central AsiaEurope & Central Asia (excluding high income)Europe & Central Asia (IDA & IBRD countries)European UnionFijiFinlandFragile and conflict affected situationsFranceGabonGambia, TheGeorgiaGermanyGhanaGreeceGrenadaGuatemalaGuineaGuinea-BissauGuyanaHaitiHeavily indebted poor countries (HIPC)High incomeHondurasHong Kong SAR, ChinaHungaryIBRD onlyIcelandIDA & IBRD totalIDA blendIDA onlyIDA totalIndiaIndonesiaIran, Islamic Rep.IraqIrelandIsraelItalyJamaicaJapanJordanKazakhstanKenyaKorea, Dem. People’s Rep.Korea, Rep.KuwaitKyrgyz RepublicLao PDRLate-demographic dividendLatin America & Caribbean Latin America & Caribbean (excluding high income)Latin America & the Caribbean (IDA & IBRD countries)LatviaLeast developed countries: UN classificationLebanonLesothoLiberiaLibyaLiechtensteinLithuaniaLow & middle incomeLow incomeLower middle incomeLuxembourgMacao SAR, ChinaMacedonia, FYRMadagascarMalawiMaldivesMaliMaltaMarshall IslandsMauritaniaMauritiusMexicoMicronesia, Fed. Sts.Middle East & North AfricaMiddle East & North Africa (excluding high income)Middle East & North Africa (IDA & IBRD countries)Middle incomeMoldovaMongoliaMontenegroMoroccoMozambiqueMyanmarNamibiaNepalNetherlandsNew ZealandNicaraguaNigerNigeriaNorth AmericaNorwayOECD membersOmanOther small statesPacific island small statesPakistanPalauPanamaPapua New GuineaParaguayPeruPhilippinesPolandPortugalPost-demographic dividendPre-demographic dividendPuerto RicoQatarRomaniaRussian FederationRwandaSamoaSan MarinoSao Tome and PrincipeSaudi ArabiaSenegalSerbiaSeychellesSierra LeoneSingaporeSlovak RepublicSloveniaSmall statesSomaliaSouth AfricaSouth AsiaSouth Asia (IDA & IBRD)SpainSri LankaSt. Kitts and NevisSt. LuciaSt. Vincent and the GrenadinesSub-Saharan Africa Sub-Saharan Africa (excluding high income)Sub-Saharan Africa (IDA & IBRD countries)SudanSurinameSwazilandSwedenSwitzerlandSyrian Arab RepublicTajikistanTanzaniaThailandTimor-LesteTogoTongaTrinidad and TobagoTunisiaTurkeyTurkmenistanUgandaUkraineUnited Arab EmiratesUnited KingdomUnited StatesUpper middle incomeUruguayUzbekistanVanuatuVenezuela, RBVietnamWest Bank and GazaWorldYemen, Rep.ZambiaZimbabwe

Zeitlinie:

Diese Zeitleiste vorliegt die Graphik ab 1977 J. bis 2015 J. Vietnam. Die Angaben bis 1976 J. sind nicht vorhanden. Die Zahl aktueller Beobachtungen nach Daten: 20.

Die Quelle (Bezeichnung):

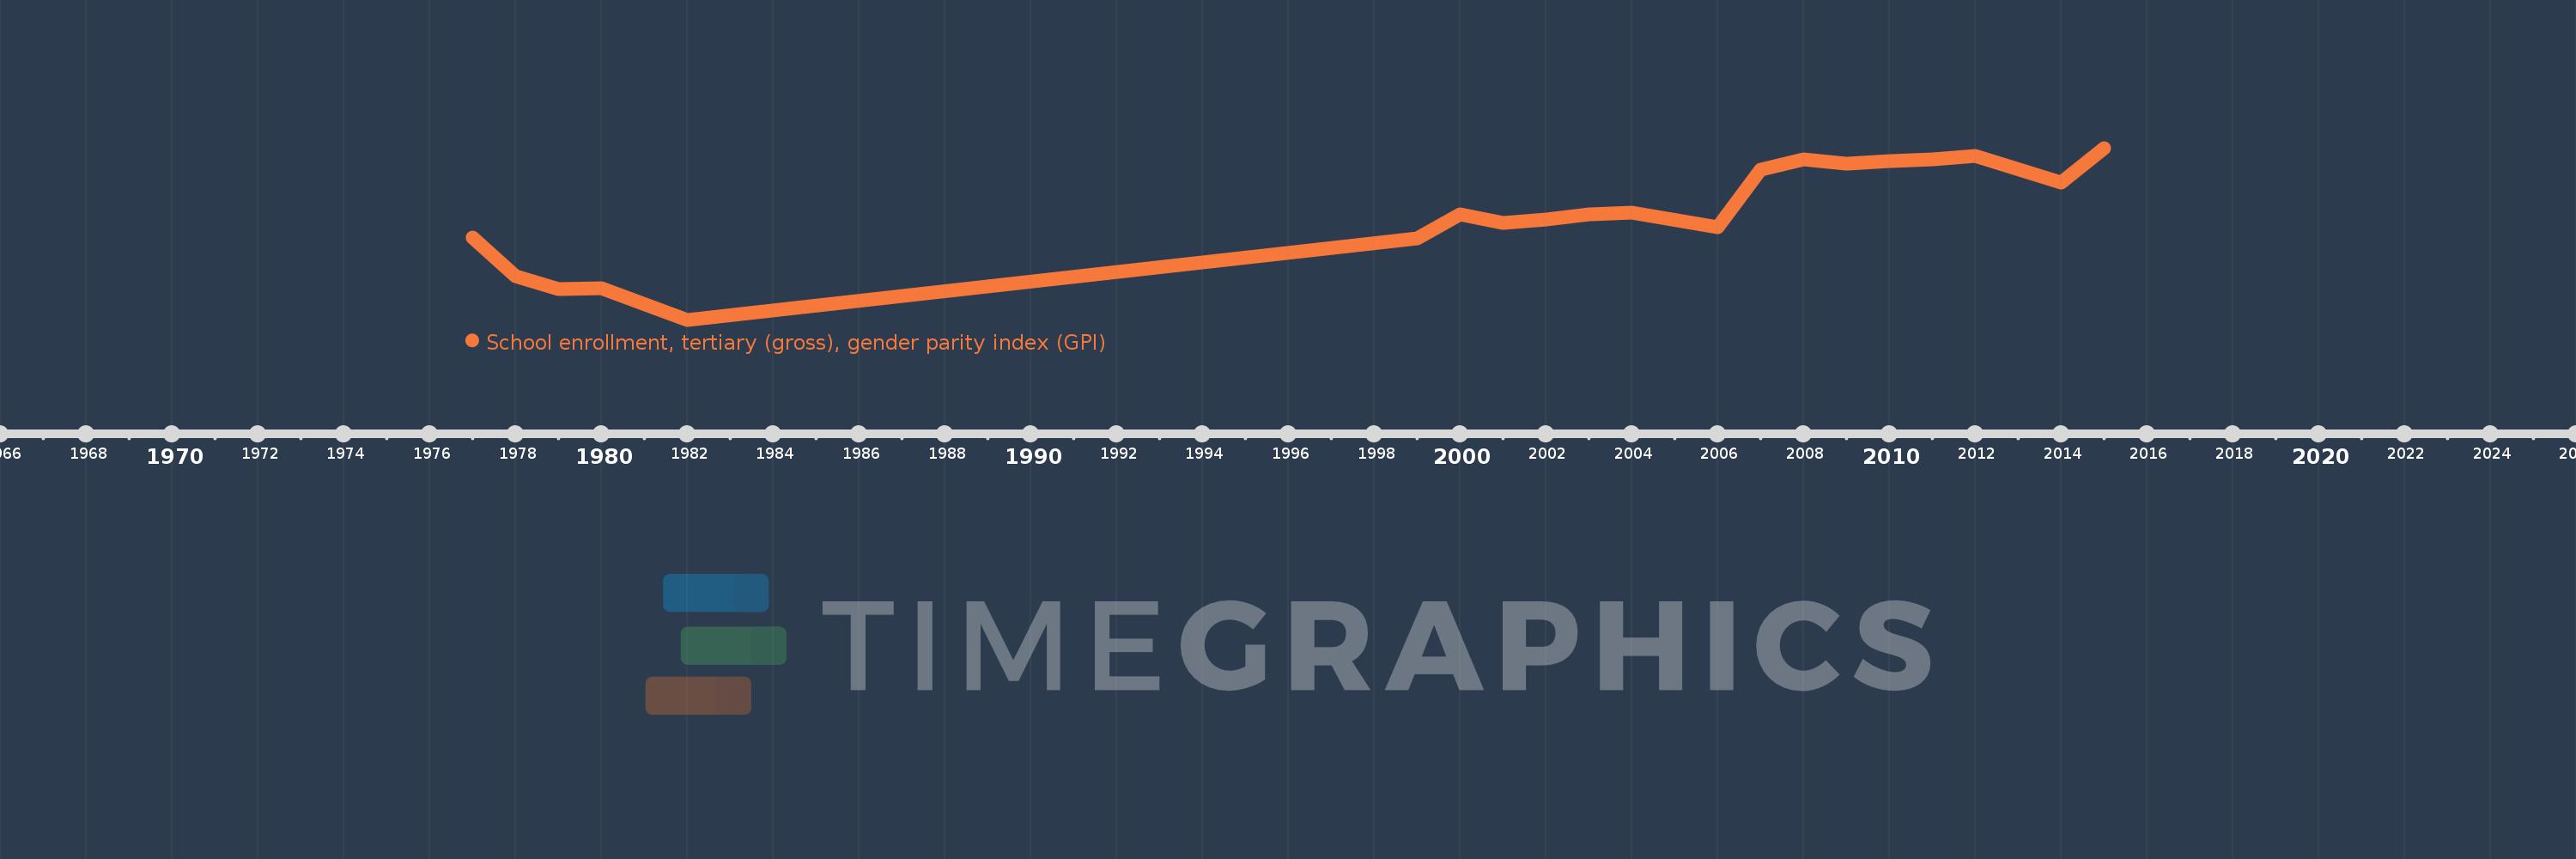
Kennzahlen der Weltentwicklung

Die Quelle (Einrichtung):

United Nations Educational, Scientific, and Cultural Organization (UNESCO) Institute for Statistics.

Kategorien:

Education, Gender, Social Development

Es wurde aktualisiert:

23 Apr 2017 Jahr

Kennzahlen der Wertänderungen vom Jahr zum Jahr

im Durchschnitt:
0.77
Minimum:
0.313
1 Jan 1982 Jahr
Maximum:
1.05
1 Jan 2015 Jahr
Zum Datum der Beobachtung
Wert
Absolute Veränderung
Die Veränderung bezüglich dem vorherigen Wert
1 Jan 1977 Jahr
0.664
+0.664
0.0%
1 Jan 1978 Jahr
0.498
-0.166
-25.0%
1 Jan 1979 Jahr
0.444
-0.054
-10.81%
1 Jan 1980 Jahr
0.447
+0.003
0.7%
1 Jan 1982 Jahr
0.313
-0.134
-30.04%
1 Jan 1999 Jahr
0.662
+0.349
111.68%
1 Jan 2000 Jahr
0.765
+0.103
15.55%
1 Jan 2001 Jahr
0.728
-0.038
-4.93%
1 Jan 2002 Jahr
0.742
+0.014
1.91%
1 Jan 2003 Jahr
0.765
+0.023
3.15%
1 Jan 2004 Jahr
0.772
+0.007
0.86%
1 Jan 2006 Jahr
0.71
-0.061
-7.96%
1 Jan 2007 Jahr
0.957
+0.247
34.74%
1 Jan 2008 Jahr
1.001
+0.044
4.6%
1 Jan 2009 Jahr
0.981
-0.02
-2.0%
1 Jan 2010 Jahr
0.992
+0.011
1.12%
1 Jan 2011 Jahr
1.002
+0.011
1.06%
1 Jan 2012 Jahr
1.014
+0.012
1.15%
1 Jan 2014 Jahr
0.902
-0.112
-11.08%
1 Jan 2015 Jahr
1.05
+0.148
16.41%

Bewertung der Länder gemäß mit laufender Statistik nach Jahren