29
/de/
de
AIzaSyAYiBZKx7MnpbEhh9jyipgxe19OcubqV5w
April 1, 2024
282733
Vietnam
VNM
true
2
1
Out-of-school children of primary school age, both sexes (number)
2014,2013,2012,2011,2010,2009,2007,2006,2003,2002,2001,2000,1999,1986,1982,1979,1978
Download
Bibliothek der Globalstatistik →Vietnam →

Out-of-school children of primary school age, both sexes (number)

Diese Statistik in anderen Ländern:
AfghanistanAlbaniaAlgeriaAngolaAntigua and BarbudaArab WorldArgentinaArmeniaArubaAustraliaAustriaAzerbaijanBahamas, TheBahrainBangladeshBarbadosBelarusBelgiumBelizeBeninBermudaBhutanBoliviaBosnia and HerzegovinaBotswanaBrazilBrunei DarussalamBulgariaBurkina FasoBurundiCabo VerdeCambodiaCameroonCanadaCaribbean small statesCentral African RepublicCentral Europe and the BalticsChadChileChinaColombiaComorosCongo, Dem. Rep.Congo, Rep.Costa RicaCote d'IvoireCroatiaCubaCyprusDenmarkDjiboutiDominicaDominican RepublicEarly-demographic dividendEast Asia & PacificEast Asia & Pacific (excluding high income)East Asia & Pacific (IDA & IBRD countries)EcuadorEgypt, Arab Rep.El SalvadorEquatorial GuineaEritreaEstoniaEthiopiaEuro areaEurope & Central AsiaEurope & Central Asia (excluding high income)Europe & Central Asia (IDA & IBRD countries)European UnionFijiFinlandFragile and conflict affected situationsFranceGabonGambia, TheGeorgiaGermanyGhanaGreeceGrenadaGuatemalaGuineaGuinea-BissauGuyanaHaitiHeavily indebted poor countries (HIPC)High incomeHondurasHong Kong SAR, ChinaHungaryIBRD onlyIcelandIDA & IBRD totalIDA blendIDA onlyIDA totalIndiaIndonesiaIran, Islamic Rep.IraqIrelandIsraelItalyJamaicaJapanJordanKazakhstanKenyaKiribatiKorea, Dem. People’s Rep.Korea, Rep.KuwaitKyrgyz RepublicLao PDRLate-demographic dividendLatin America & Caribbean Latin America & Caribbean (excluding high income)Latin America & the Caribbean (IDA & IBRD countries)LatviaLeast developed countries: UN classificationLebanonLesothoLiberiaLibyaLiechtensteinLithuaniaLow & middle incomeLow incomeLower middle incomeLuxembourgMacao SAR, ChinaMacedonia, FYRMadagascarMalawiMalaysiaMaldivesMaliMaltaMarshall IslandsMauritaniaMauritiusMexicoMicronesia, Fed. Sts.Middle East & North AfricaMiddle East & North Africa (excluding high income)Middle East & North Africa (IDA & IBRD countries)Middle incomeMoldovaMongoliaMontenegroMoroccoMozambiqueMyanmarNamibiaNauruNepalNetherlandsNew ZealandNicaraguaNigerNigeriaNorth AmericaNorwayOECD membersOmanOther small statesPacific island small statesPakistanPalauPanamaPapua New GuineaParaguayPeruPhilippinesPolandPortugalPost-demographic dividendPre-demographic dividendPuerto RicoQatarRomaniaRussian FederationRwandaSamoaSan MarinoSao Tome and PrincipeSaudi ArabiaSenegalSerbiaSeychellesSierra LeoneSloveniaSmall statesSolomon IslandsSomaliaSouth AfricaSouth AsiaSouth Asia (IDA & IBRD)South SudanSpainSri LankaSt. Kitts and NevisSt. LuciaSt. Vincent and the GrenadinesSub-Saharan Africa Sub-Saharan Africa (excluding high income)Sub-Saharan Africa (IDA & IBRD countries)SudanSurinameSwazilandSwedenSwitzerlandSyrian Arab RepublicTajikistanTanzaniaThailandTimor-LesteTogoTongaTrinidad and TobagoTunisiaTurkeyTuvaluUgandaUkraineUnited Arab EmiratesUnited KingdomUnited StatesUpper middle incomeUruguayUzbekistanVanuatuVenezuela, RBVietnamWest Bank and GazaWorldYemen, Rep.ZambiaZimbabwe
Zeitlinie:
Diese Zeitleiste vorliegt die Graphik ab 1978 J. bis 2014 J. Vietnam. Die Angaben bis 1977 J. sind nicht vorhanden. Die Zahl aktueller Beobachtungen nach Daten: 17.
Die Quelle (Bezeichnung):
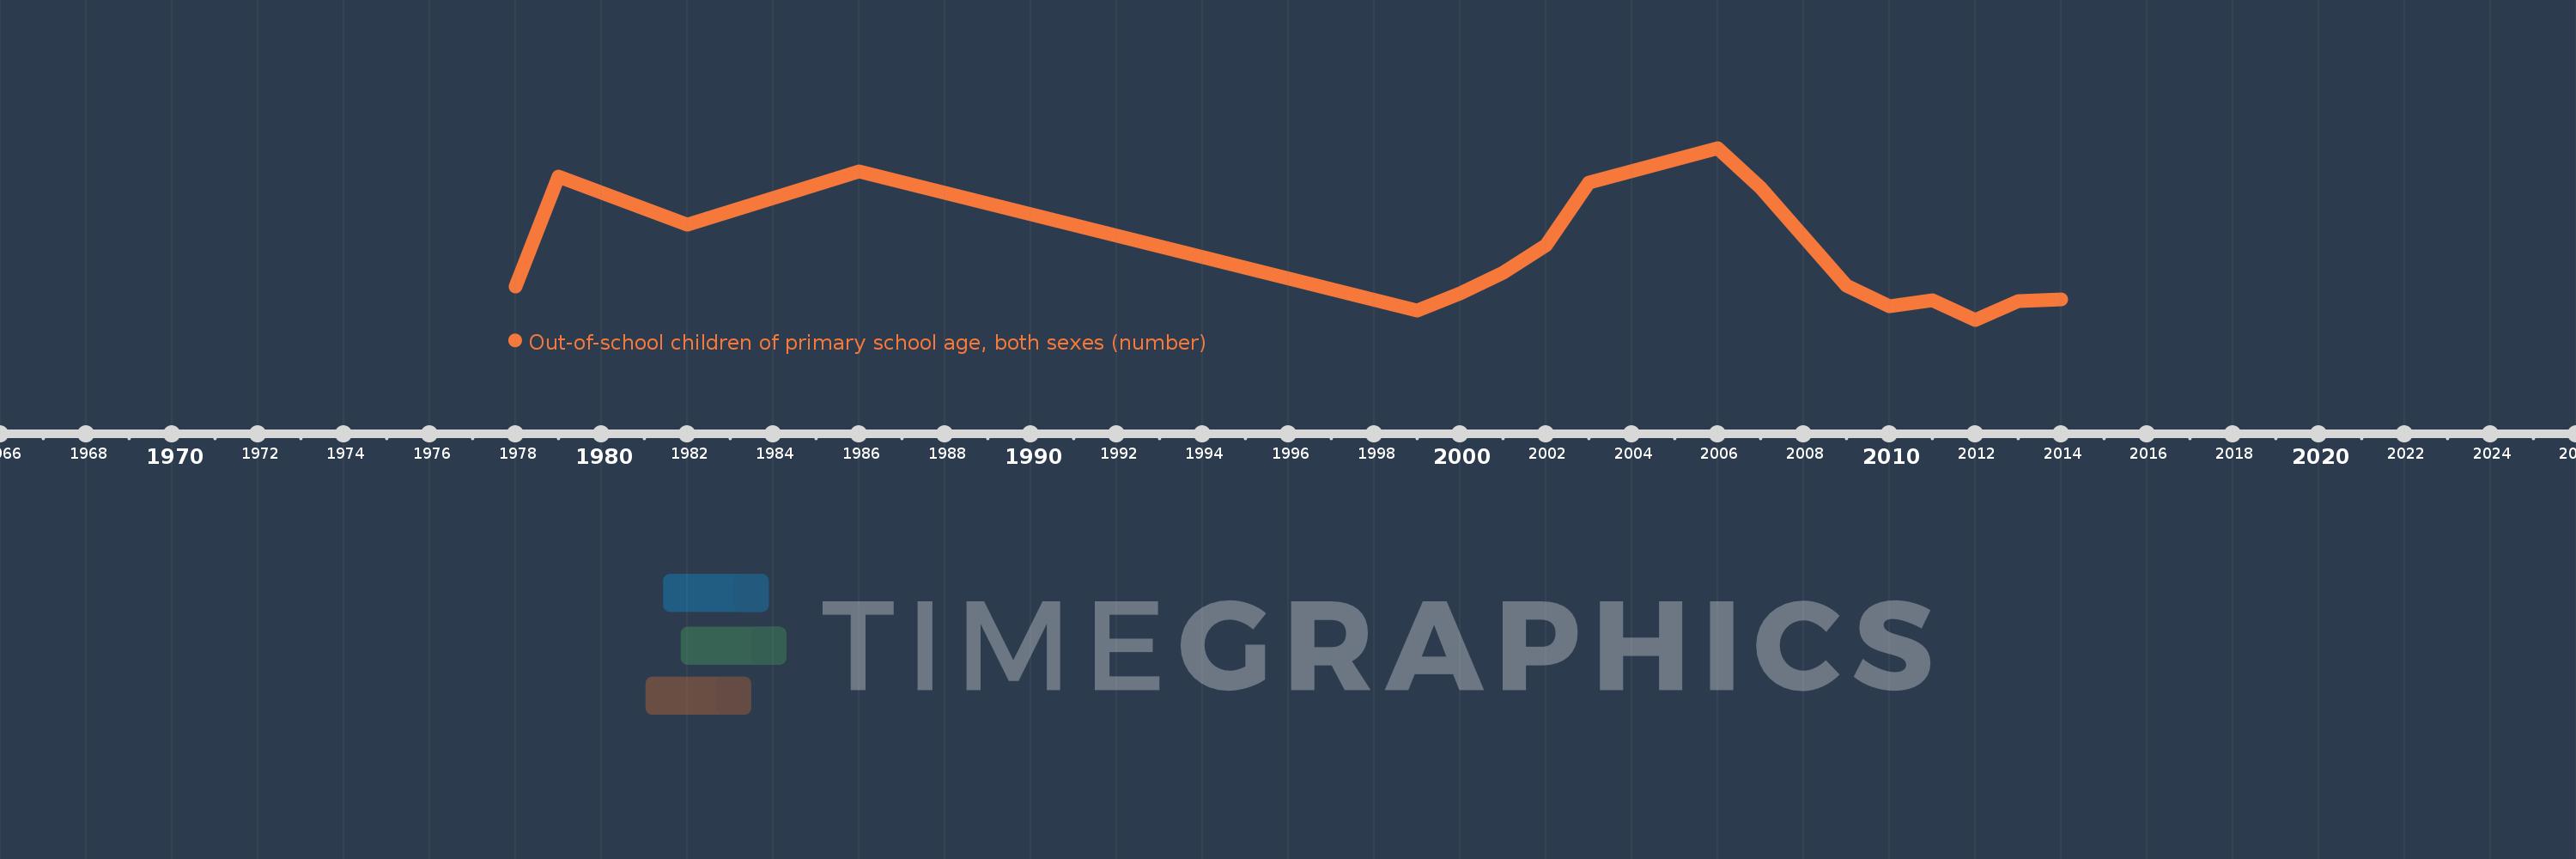
Kennzahlen der Weltentwicklung
Die Quelle (Einrichtung):
UNESCO Institute for Statistics
Kategorien:
Education
Es wurde aktualisiert:
23 Apr 2017 Jahr
Kennzahlen der Wertänderungen vom Jahr zum Jahr
im Durchschnitt:
325.236 Tsnd.
Minimum:
39.65 Tsnd.
1 Jan 2012 Jahr
Maximum:
782.11 Tsnd.
1 Jan 2006 Jahr
Zum Datum der Beobachtung
Wert
Absolute Veränderung
Die Veränderung bezüglich dem vorherigen Wert
1 Jan 1978 Jahr
181.896 Tsnd.
+181.896 Tsnd.
0.0%
1 Jan 1979 Jahr
659.412 Tsnd.
+477.516 Tsnd.
262.52%
1 Jan 1982 Jahr
451.219 Tsnd.
-208.193 Tsnd.
-31.57%
1 Jan 1986 Jahr
681.263 Tsnd.
+230.044 Tsnd.
50.98%
1 Jan 1999 Jahr
79.712 Tsnd.
-601.551 Tsnd.
-88.3%
1 Jan 2000 Jahr
152.293 Tsnd.
+72.581 Tsnd.
91.05%
1 Jan 2001 Jahr
244.243 Tsnd.
+91.95 Tsnd.
60.38%
1 Jan 2002 Jahr
362.435 Tsnd.
+118.192 Tsnd.
48.39%
1 Jan 2003 Jahr
632.62 Tsnd.
+270.185 Tsnd.
74.55%
1 Jan 2006 Jahr
782.11 Tsnd.
+149.49 Tsnd.
23.63%
1 Jan 2007 Jahr
609.069 Tsnd.
-173.041 Tsnd.
-22.12%
1 Jan 2009 Jahr
185.25 Tsnd.
-423.819 Tsnd.
-69.58%
1 Jan 2010 Jahr
98.924 Tsnd.
-86.326 Tsnd.
-46.6%
1 Jan 2011 Jahr
122.606 Tsnd.
+23.682 Tsnd.
23.94%
1 Jan 2012 Jahr
39.65 Tsnd.
-82.956 Tsnd.
-67.66%
1 Jan 2013 Jahr
119.398 Tsnd.
+79.748 Tsnd.
201.13%
1 Jan 2014 Jahr
126.913 Tsnd.
+7.515 Tsnd.
6.29%
Bewertung der Länder gemäß mit laufender Statistik nach Jahren

Kommentare:

Abschicken
PremiumAbout & FeedbackVereinbarungPrivatheit
logo
© 2022 Selected Technologies LLC – Morgan Hill, California