33
/de/
AIzaSyAYiBZKx7MnpbEhh9jyipgxe19OcubqV5w
August 1, 2025
278204
Uruguay
URY
true
2
1
Rail lines (total route-km)
2009,2005,2004,2003,2002,2001,2000,1999,1998,1997,1994,1993,1992,1991,1990,1989,1988,1987,1986,1985,1984,1983,1982,1981
Download
Bibliothek der Globalstatistik →Uruguay →

Rail lines (total route-km)

Diese Statistik in anderen Ländern:

AlbaniaAlgeriaArab WorldArgentinaArmeniaAustraliaAustriaAzerbaijanBangladeshBelarusBelgiumBeninBoliviaBosnia and HerzegovinaBotswanaBrazilBulgariaBurkina FasoCambodiaCameroonCanadaCentral Europe and the BalticsChileChinaColombiaCongo, Dem. Rep.Congo, Rep.Costa RicaCote d'IvoireCroatiaCubaCzech RepublicDenmarkDjiboutiEarly-demographic dividendEast Asia & PacificEast Asia & Pacific (excluding high income)East Asia & Pacific (IDA & IBRD countries)Egypt, Arab Rep.EstoniaEthiopiaEuro areaEurope & Central AsiaEurope & Central Asia (excluding high income)Europe & Central Asia (IDA & IBRD countries)European UnionFinlandFragile and conflict affected situationsFranceGabonGeorgiaGermanyGhanaGreeceHeavily indebted poor countries (HIPC)High incomeHungaryIBRD onlyIDA & IBRD totalIDA blendIDA onlyIDA totalIndiaIndonesiaIran, Islamic Rep.IraqIrelandIsraelItalyJapanJordanKazakhstanKenyaKorea, Rep.Kyrgyz RepublicLate-demographic dividendLatin America & Caribbean Latin America & Caribbean (excluding high income)Latin America & the Caribbean (IDA & IBRD countries)LatviaLeast developed countries: UN classificationLithuaniaLow & middle incomeLow incomeLower middle incomeLuxembourgMacedonia, FYRMadagascarMalawiMalaysiaMaliMauritaniaMexicoMiddle East & North AfricaMiddle East & North Africa (excluding high income)Middle East & North Africa (IDA & IBRD countries)Middle incomeMoldovaMongoliaMoroccoMozambiqueMyanmarNamibiaNetherlandsNew ZealandNigeriaNorth AmericaNorwayOECD membersOther small statesPakistanPeruPhilippinesPolandPortugalPost-demographic dividendPre-demographic dividendRomaniaRussian FederationSaudi ArabiaSenegalSerbiaSlovak RepublicSloveniaSmall statesSouth AfricaSouth AsiaSouth Asia (IDA & IBRD)SpainSri LankaSub-Saharan Africa Sub-Saharan Africa (excluding high income)Sub-Saharan Africa (IDA & IBRD countries)SudanSwazilandSwedenSwitzerlandSyrian Arab RepublicTajikistanTanzaniaThailandTunisiaTurkeyTurkmenistanUgandaUkraineUnited KingdomUnited StatesUpper middle incomeUruguayUzbekistanVenezuela, RBVietnamWorldZambiaZimbabwe

Zeitlinie:

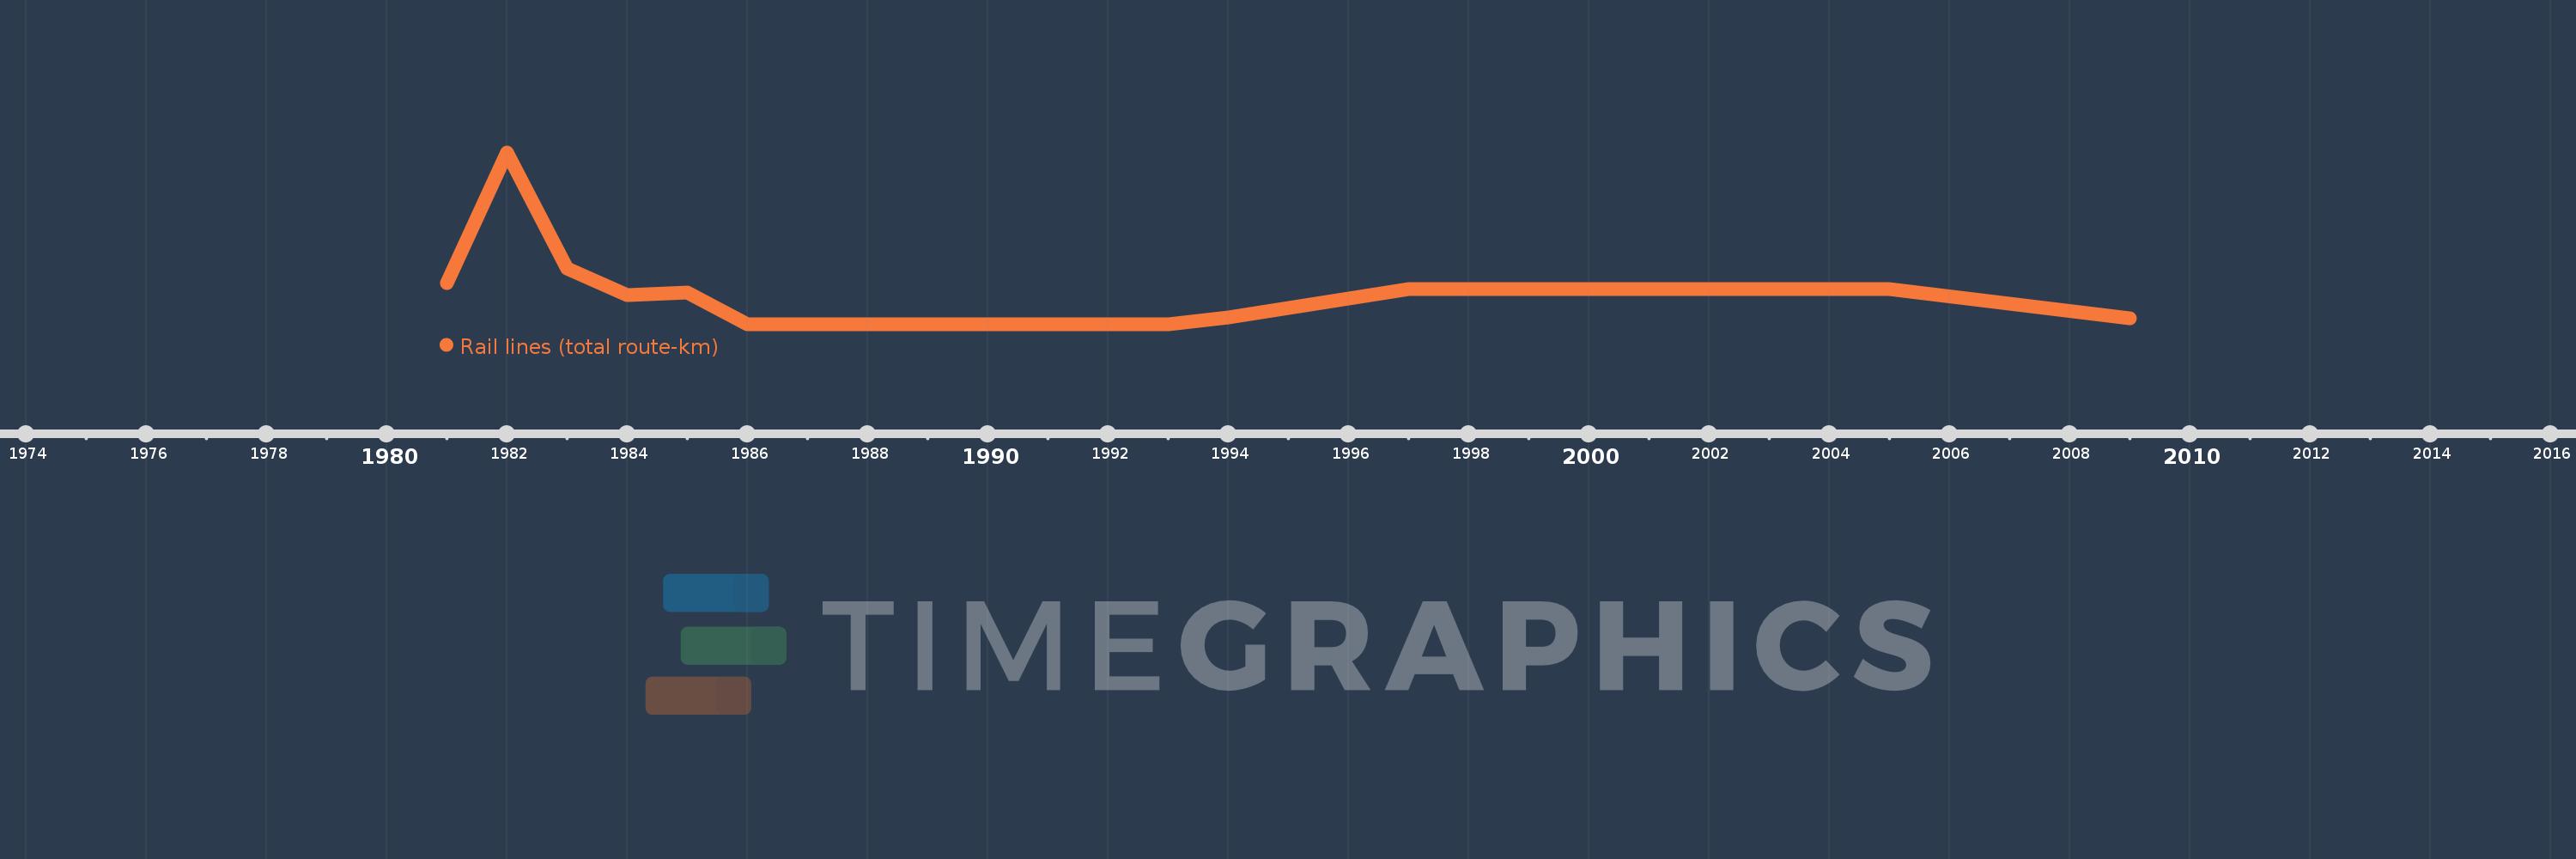
Diese Zeitleiste vorliegt die Graphik ab 1981 J. bis 2009 J. Uruguay. Die Angaben bis 1980 J. sind nicht vorhanden. Die Zahl aktueller Beobachtungen nach Daten: 24.

Die Quelle (Bezeichnung):

Kennzahlen der Weltentwicklung

Die Quelle (Einrichtung):

World Bank, Transportation, Water, and Information and Communications Technologies Department, Transport Division.

Kategorien:

Infrastructure

Es wurde aktualisiert:

23 Apr 2017 Jahr

Kennzahlen der Wertänderungen vom Jahr zum Jahr

im Durchschnitt:
3.0 Tsnd.
Minimum:
2.991 Tsnd.
1 Jan 1986 Jahr
Maximum:
3.05 Tsnd.
1 Jan 1982 Jahr
Zum Datum der Beobachtung
Wert
Absolute Veränderung
Die Veränderung bezüglich dem vorherigen Wert
1 Jan 1981 Jahr
3.005 Tsnd.
+3.005 Tsnd.
0.0%
1 Jan 1982 Jahr
3.05 Tsnd.
+45.0
1.5%
1 Jan 1983 Jahr
3.01 Tsnd.
-40.0
-1.31%
1 Jan 1984 Jahr
3.001 Tsnd.
-9.0
-0.3%
1 Jan 1985 Jahr
3.002 Tsnd.
+1.0
0.03%
1 Jan 1986 Jahr
2.991 Tsnd.
-11.0
-0.37%
1 Jan 1987 Jahr
2.991 Tsnd.
0.0
0.0%
1 Jan 1988 Jahr
2.991 Tsnd.
0.0
0.0%
1 Jan 1989 Jahr
2.991 Tsnd.
0.0
0.0%
1 Jan 1990 Jahr
2.991 Tsnd.
0.0
0.0%
1 Jan 1991 Jahr
2.991 Tsnd.
0.0
0.0%
1 Jan 1992 Jahr
2.991 Tsnd.
0.0
0.0%
1 Jan 1993 Jahr
2.991 Tsnd.
0.0
0.0%
1 Jan 1994 Jahr
2.993 Tsnd.
+2.3
0.08%
1 Jan 1997 Jahr
3.003 Tsnd.
+9.7
0.32%
1 Jan 1998 Jahr
3.003 Tsnd.
0.0
0.0%
1 Jan 1999 Jahr
3.003 Tsnd.
0.0
0.0%
1 Jan 2000 Jahr
3.003 Tsnd.
0.0
0.0%
1 Jan 2001 Jahr
3.003 Tsnd.
0.0
0.0%
1 Jan 2002 Jahr
3.003 Tsnd.
0.0
0.0%
1 Jan 2003 Jahr
3.003 Tsnd.
0.0
0.0%
1 Jan 2004 Jahr
3.003 Tsnd.
0.0
0.0%
1 Jan 2005 Jahr
3.003 Tsnd.
0.0
0.0%
1 Jan 2009 Jahr
2.993 Tsnd.
-10.0
-0.33%

Bewertung der Länder gemäß mit laufender Statistik nach Jahren