29
/de/
de
AIzaSyAYiBZKx7MnpbEhh9jyipgxe19OcubqV5w
April 1, 2024
271004
Turkmenistan
TKM
true
2
1
Services, etc., value added (annual % growth)
2007,2006,2005,2004,2003,2002,2001,2000,1999,1998,1997,1996,1995,1994,1993
Download
Bibliothek der Globalstatistik →Turkmenistan →

Services, etc., value added (annual % growth)

Diese Statistik in anderen Ländern:
AfghanistanAlbaniaAlgeriaAntigua and BarbudaArab WorldArgentinaArmeniaAustraliaAustriaAzerbaijanBahamas, TheBahrainBangladeshBelarusBelgiumBelizeBeninBermudaBhutanBoliviaBosnia and HerzegovinaBotswanaBrazilBrunei DarussalamBulgariaBurkina FasoBurundiCabo VerdeCambodiaCameroonCanadaCaribbean small statesCentral African RepublicCentral Europe and the BalticsChadChileChinaColombiaComorosCongo, Dem. Rep.Congo, Rep.Costa RicaCote d'IvoireCroatiaCubaCyprusCzech RepublicDenmarkDjiboutiDominicaDominican RepublicEarly-demographic dividendEast Asia & PacificEast Asia & Pacific (excluding high income)East Asia & Pacific (IDA & IBRD countries)EcuadorEgypt, Arab Rep.El SalvadorEquatorial GuineaEritreaEstoniaEthiopiaEuro areaEurope & Central AsiaEurope & Central Asia (excluding high income)Europe & Central Asia (IDA & IBRD countries)European UnionFijiFinlandFragile and conflict affected situationsFranceGabonGambia, TheGeorgiaGermanyGhanaGreeceGrenadaGuatemalaGuineaGuinea-BissauGuyanaHaitiHeavily indebted poor countries (HIPC)High incomeHondurasHong Kong SAR, ChinaHungaryIBRD onlyIcelandIDA & IBRD totalIDA blendIDA onlyIDA totalIndiaIndonesiaIran, Islamic Rep.IraqIrelandItalyJamaicaJapanJordanKazakhstanKenyaKiribatiKorea, Rep.KosovoKuwaitKyrgyz RepublicLao PDRLate-demographic dividendLatin America & Caribbean Latin America & Caribbean (excluding high income)Latin America & the Caribbean (IDA & IBRD countries)LatviaLeast developed countries: UN classificationLebanonLesothoLiberiaLithuaniaLow & middle incomeLow incomeLower middle incomeLuxembourgMacedonia, FYRMadagascarMalawiMalaysiaMaldivesMaliMarshall IslandsMauritaniaMauritiusMexicoMicronesia, Fed. Sts.Middle East & North AfricaMiddle East & North Africa (excluding high income)Middle East & North Africa (IDA & IBRD countries)Middle incomeMoldovaMongoliaMontenegroMoroccoMozambiqueMyanmarNamibiaNepalNetherlandsNew ZealandNicaraguaNigerNigeriaNorth AmericaNorwayOECD membersOmanOther small statesPacific island small statesPakistanPalauPanamaPapua New GuineaParaguayPeruPhilippinesPolandPortugalPost-demographic dividendPre-demographic dividendPuerto RicoQatarRomaniaRussian FederationRwandaSamoaSao Tome and PrincipeSaudi ArabiaSenegalSerbiaSeychellesSierra LeoneSingaporeSlovak RepublicSloveniaSmall statesSolomon IslandsSomaliaSouth AfricaSouth AsiaSouth Asia (IDA & IBRD)SpainSri LankaSt. Kitts and NevisSt. LuciaSt. Vincent and the GrenadinesSub-Saharan Africa Sub-Saharan Africa (excluding high income)Sub-Saharan Africa (IDA & IBRD countries)SudanSurinameSwazilandSwedenSwitzerlandSyrian Arab RepublicTajikistanTanzaniaThailandTimor-LesteTogoTongaTrinidad and TobagoTunisiaTurkeyTurkmenistanTuvaluUgandaUkraineUnited Arab EmiratesUnited KingdomUnited StatesUpper middle incomeUruguayUzbekistanVanuatuVenezuela, RBVietnamWest Bank and GazaWorldZambiaZimbabwe
Zeitlinie:
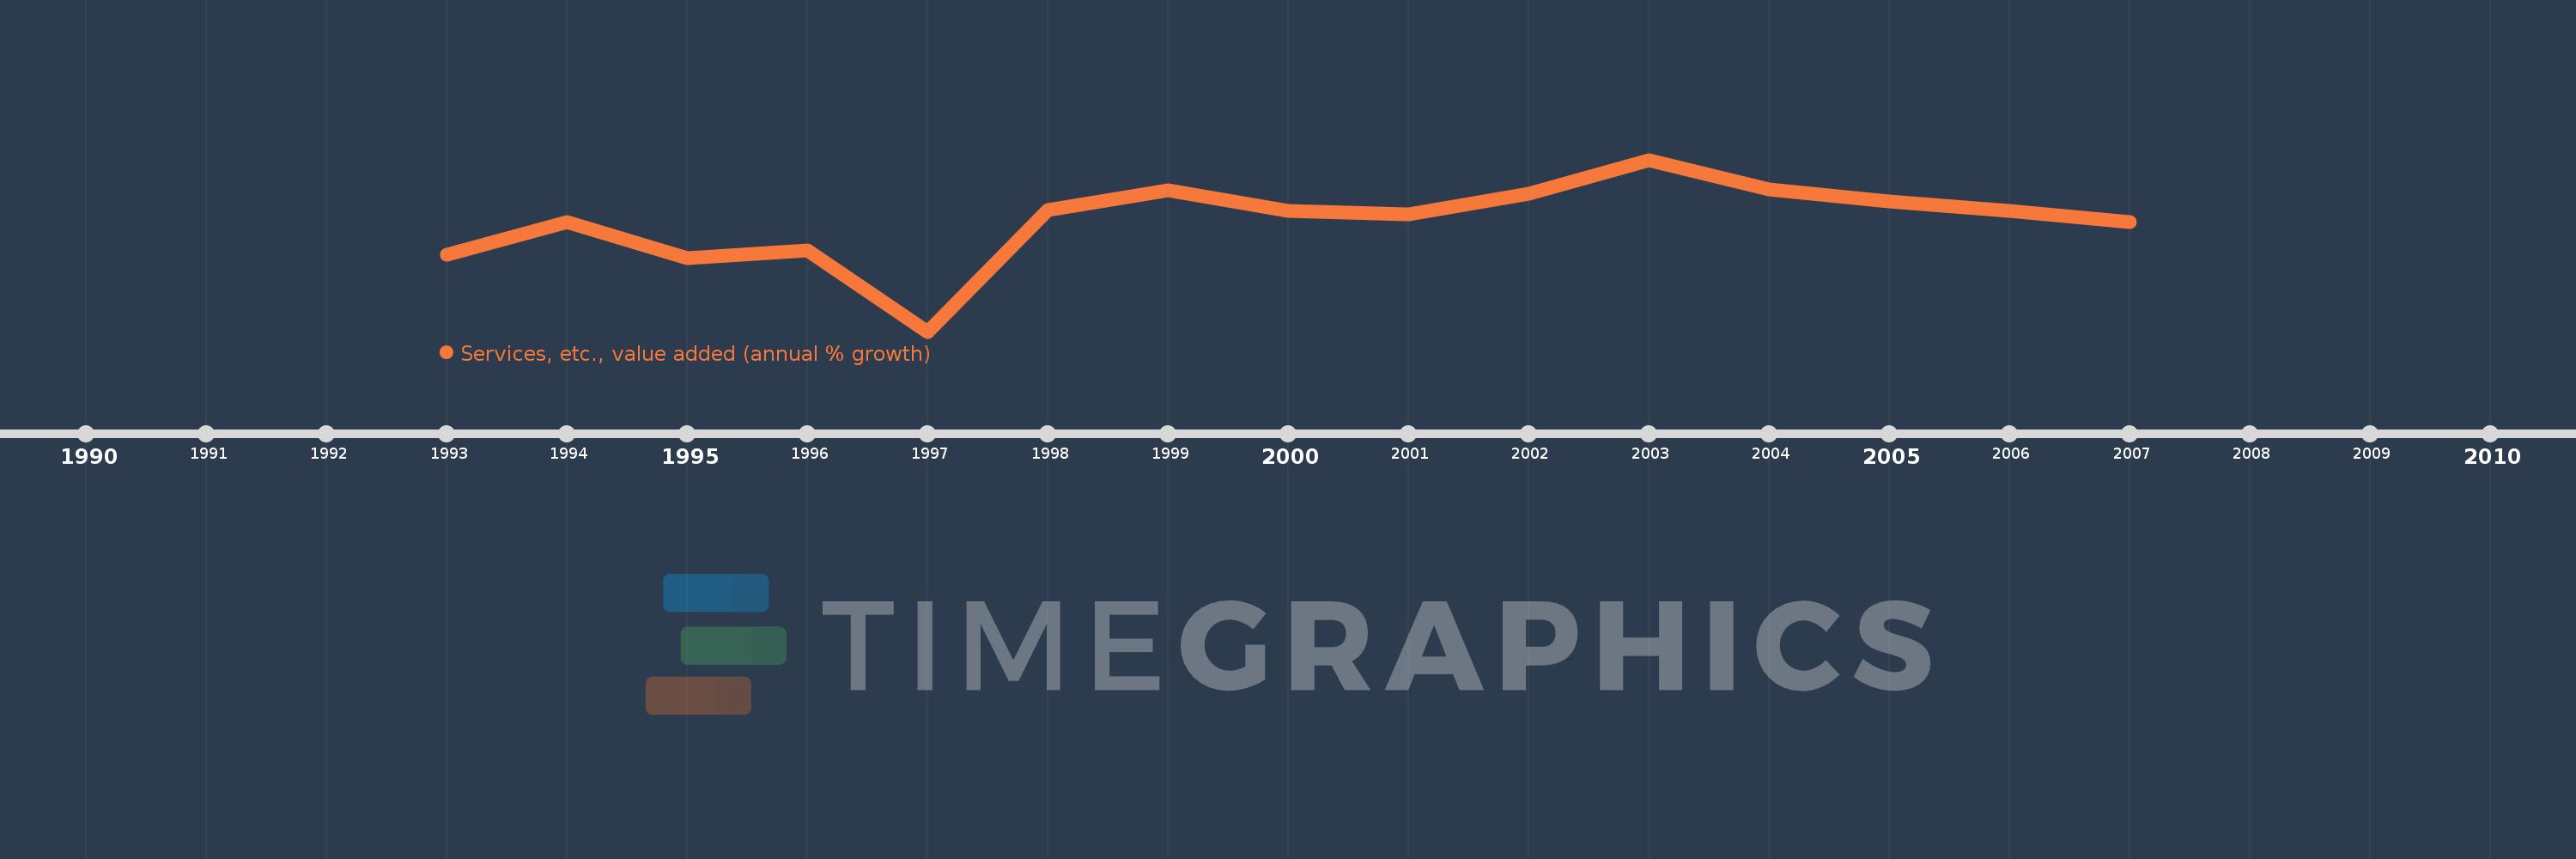
Diese Zeitleiste vorliegt die Graphik ab 1993 J. bis 2007 J. Turkmenistan. Die Angaben bis 1992 J. sind nicht vorhanden. Die Zahl aktueller Beobachtungen nach Daten: 15.
Die Quelle (Bezeichnung):
Kennzahlen der Weltentwicklung
Die Quelle (Einrichtung):
World Bank national accounts data, and OECD National Accounts data files.
Kategorien:
Economy & Growth
Es wurde aktualisiert:
23 Apr 2017 Jahr
Kennzahlen der Wertänderungen vom Jahr zum Jahr
im Durchschnitt:
8.247
Minimum:
-49.0
1 Jan 1997 Jahr
Maximum:
40.2
1 Jan 2003 Jahr
Zum Datum der Beobachtung
Wert
Absolute Veränderung
Die Veränderung bezüglich dem vorherigen Wert
1 Jan 1993 Jahr
-9.0
-9.0
0.0%
1 Jan 1994 Jahr
8.0
+17.0
-188.89%
1 Jan 1995 Jahr
-11.0
-19.0
-237.5%
1 Jan 1996 Jahr
-7.0
+4.0
-36.36%
1 Jan 1997 Jahr
-49.0
-42.0
600.0%
1 Jan 1998 Jahr
14.0
+63.0
-128.57%
1 Jan 1999 Jahr
24.4
+10.4
74.29%
1 Jan 2000 Jahr
13.8
-10.6
-43.44%
1 Jan 2001 Jahr
11.8
-2.0
-14.49%
1 Jan 2002 Jahr
22.5
+10.7
90.68%
1 Jan 2003 Jahr
40.2
+17.7
78.67%
1 Jan 2004 Jahr
24.9
-15.3
-38.06%
1 Jan 2005 Jahr
18.6
-6.3
-25.3%
1 Jan 2006 Jahr
13.6
-5.0
-26.88%
1 Jan 2007 Jahr
7.9
-5.7
-41.91%
Bewertung der Länder gemäß mit laufender Statistik nach Jahren

Kommentare:

Abschicken
PremiumAbout & FeedbackVereinbarungPrivatheit
logo
© 2022 Selected Technologies LLC – Morgan Hill, California